
Overview
The Orchard has been able to position itself as the only transparent distributor in the industry through our detailed Analytics and Accounting data within the client Workstation. In 2016 we plan to further solidify that standpoint by answering our client’s number one question - When will I make money? To do this, we want to present a clear picture of a film’s revenue in the Workstation.The main goal for this project would be to take these new and existing feeds and build them into a new Revenue Forecast tool for our Film clients.
Project Milestones Include:
Milestone 1: Data Sources
Digital Data
We already store data from our digital retailers (Video Downloads/Rentals) and expose it in Analytics. In our new Revenue tool we would want to expose Digital revenue alongside the other revenue streams. The main task here would be to take this existing digital data and ensure it is part of the new data repository.
Cable Data
Introduce daily Cable revenue to the user. We receive this data from our Rentrak feed which contains dozens of cable operators. Synergy will assist us in working the data we receive to model gross revenue to The Orchard. Our goal for the cable feed would be to provide total cable performance on a daily basis per film in the Workstation.
Term License Data
Every film’s term license agreement with a store (Netflix, Hulu, Amazon Prime, etc) has unique contract conditions that cover a film’s fee, start/end dates, and payment interval. We want to utilize license agreements to project revenue for users. This information is currently prepared and maintained by internal folks. License data will include a concrete projection of future revenue due to it not following a transactional model (like our other feeds).
Theatrical Data
Theatrical data will also be prepared by internal folks. We will be bringing in daily box office revenue across theater chains. Synergy will also assist us in working the data to model gross revenue to The Orchard.
Milestone 2: Revenue Visualization
With all revenue sources accounted for and stored, they will be presented as a cumulative revenue graph for the user as an additional tool within our current Analytics offering. The visual below models a film’s performance as each new revenue stream begins
User Experience: After entering the Workstation, a film client would navigate to Analytics in the Workstation’s Navigation toolbar. The Revenue Forecast Tool will live alongside our other Analytics products (Analytics Overview and Heatmap).
Milestone 3: Projections
With every needed source of revenue stored and displayed we will introduce projections of future revenue per feed. The rules and calculations behind the projection of each feed is still a work in progress - collaboration between developers and stakeholders is welcomed.
*Milestones 1-3 will capture required features for a releasable product*
Milestone 4: Expenses
With the storage of expenses in Accounting and the Workstation we will incorporate a film’s expenses into the Revenue Forecast. We will use the Expenses table to display expenses over time
Milestone 5: Distribution Fee
The “Distribution Fee” represents The Orchard’s split. We store this information on a film’s contract (contract level in OA).
Future Expectations/Assumptions
We anticipate future requirements for this project over time. While not all are definite, we do know that we want to eventually allow users to filter and breakdown data as we do today in Analytics. These include:
- Breakdowns by:
- Source
- Transaction Types
- Format
- Market
- Studio
- Genre
- Date (as far down as Day)
- Volume/Collection
Future milestones would also include bringing the below data into the Revenue Forecast tool:
- Expenses
- Distribution Fee (i.e. The Orchard’s split, which is a product of the accounting run)
DELIVERABLE 1: Complete Revenue Forecast Spike
Goal
Using ingested data sources from Milestone 1, the team would work to create a cumulative revenue graph for one film release - The Overnight (889845077732). The aim of the exercise was to achieve the following:
- Ingest new data sources our database currently does not store
- Model advance and available distribution fees (contract level in OA)
- Model Expenses - Release level expense table
- Experiment/Research the best data repository for our needs
- Display cumulative revenue for a single film over time in a visual
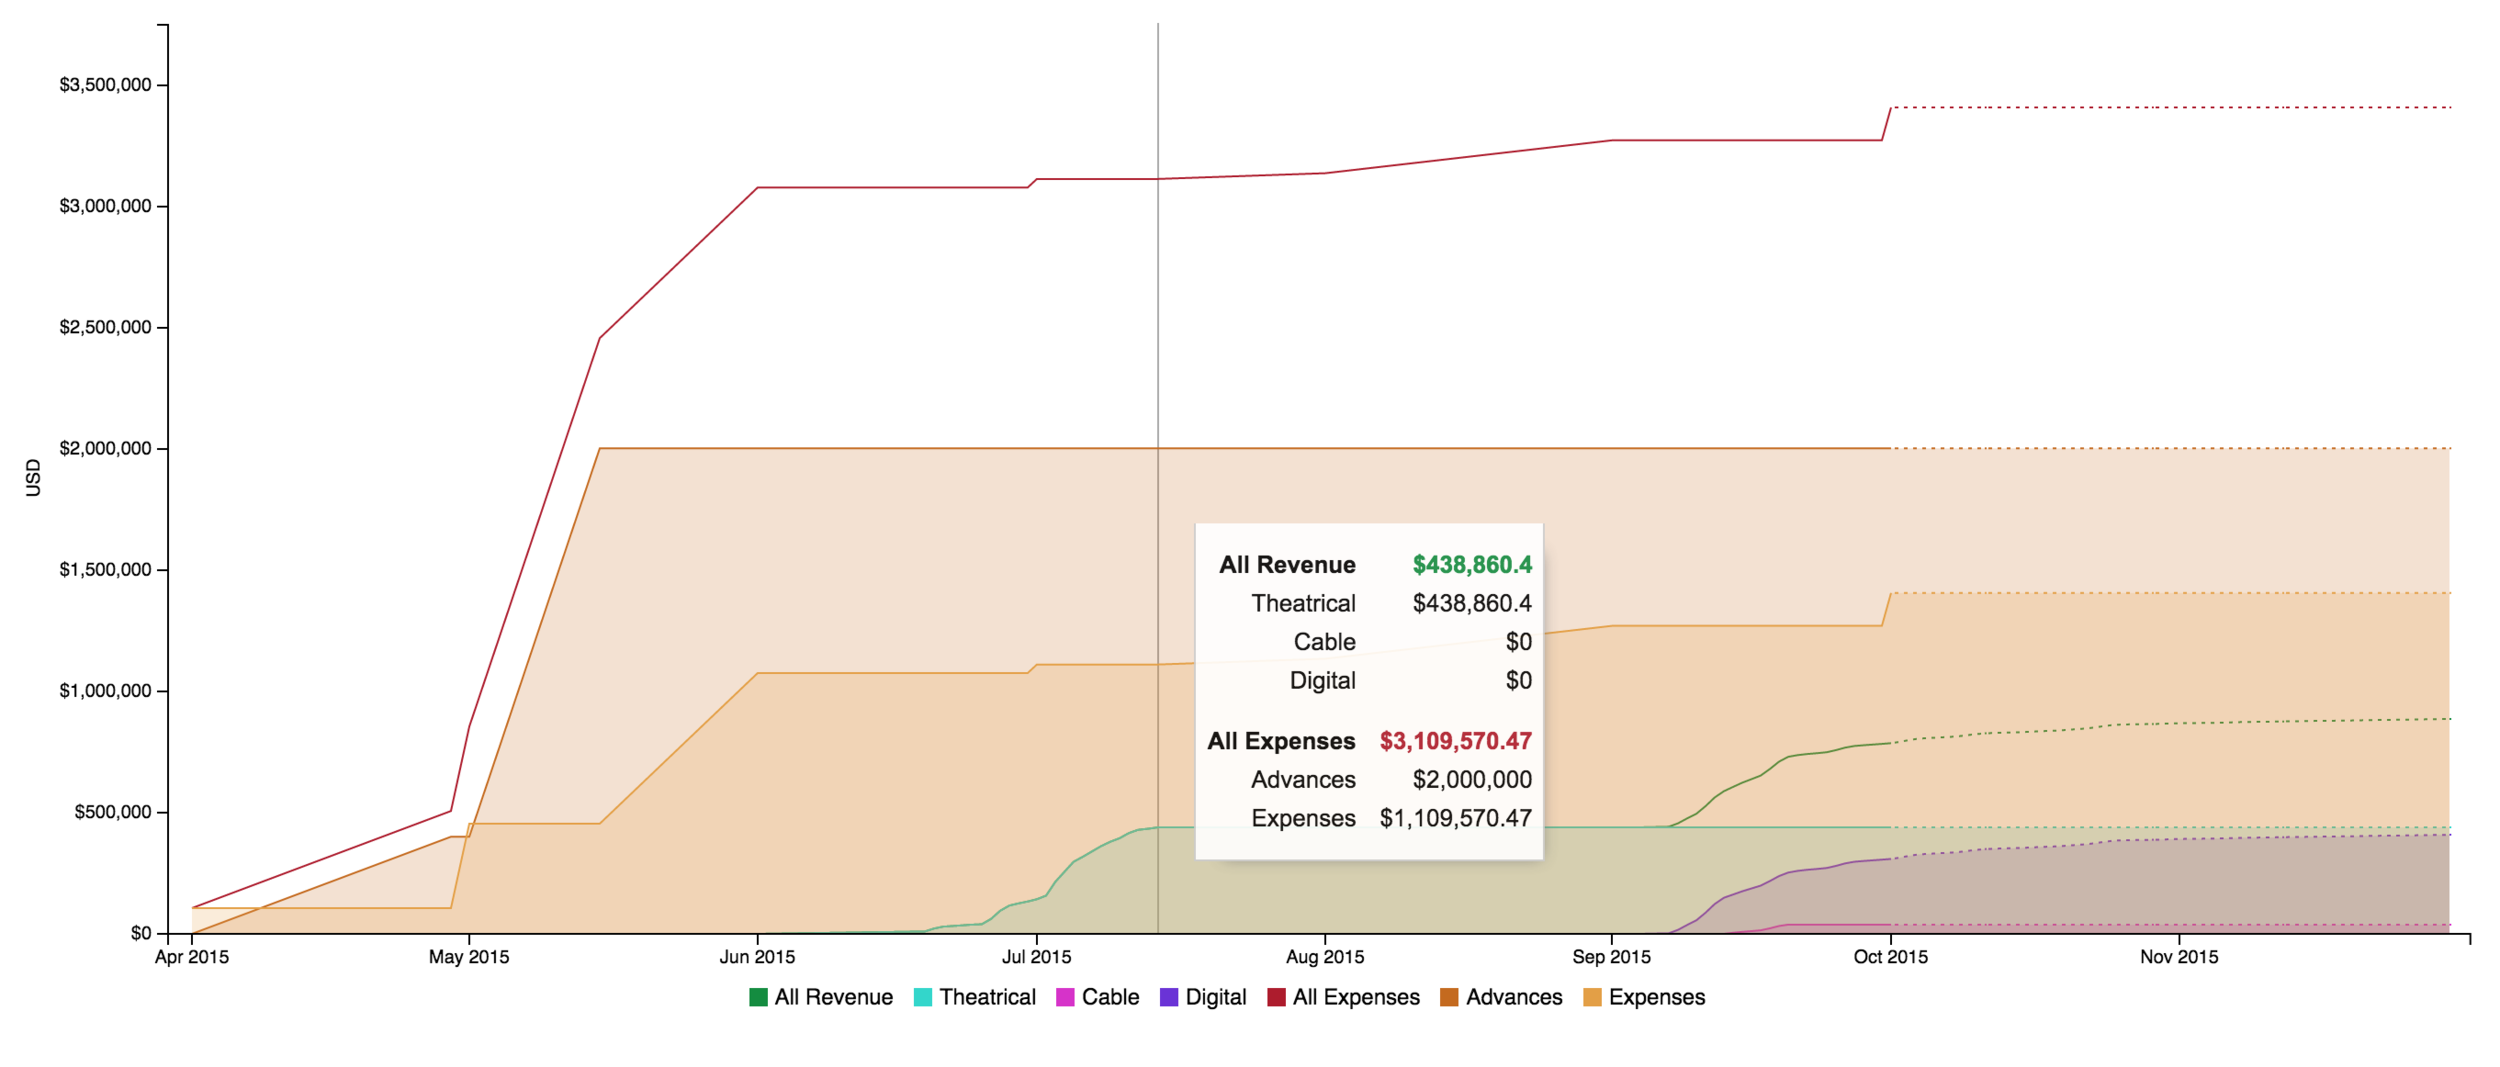
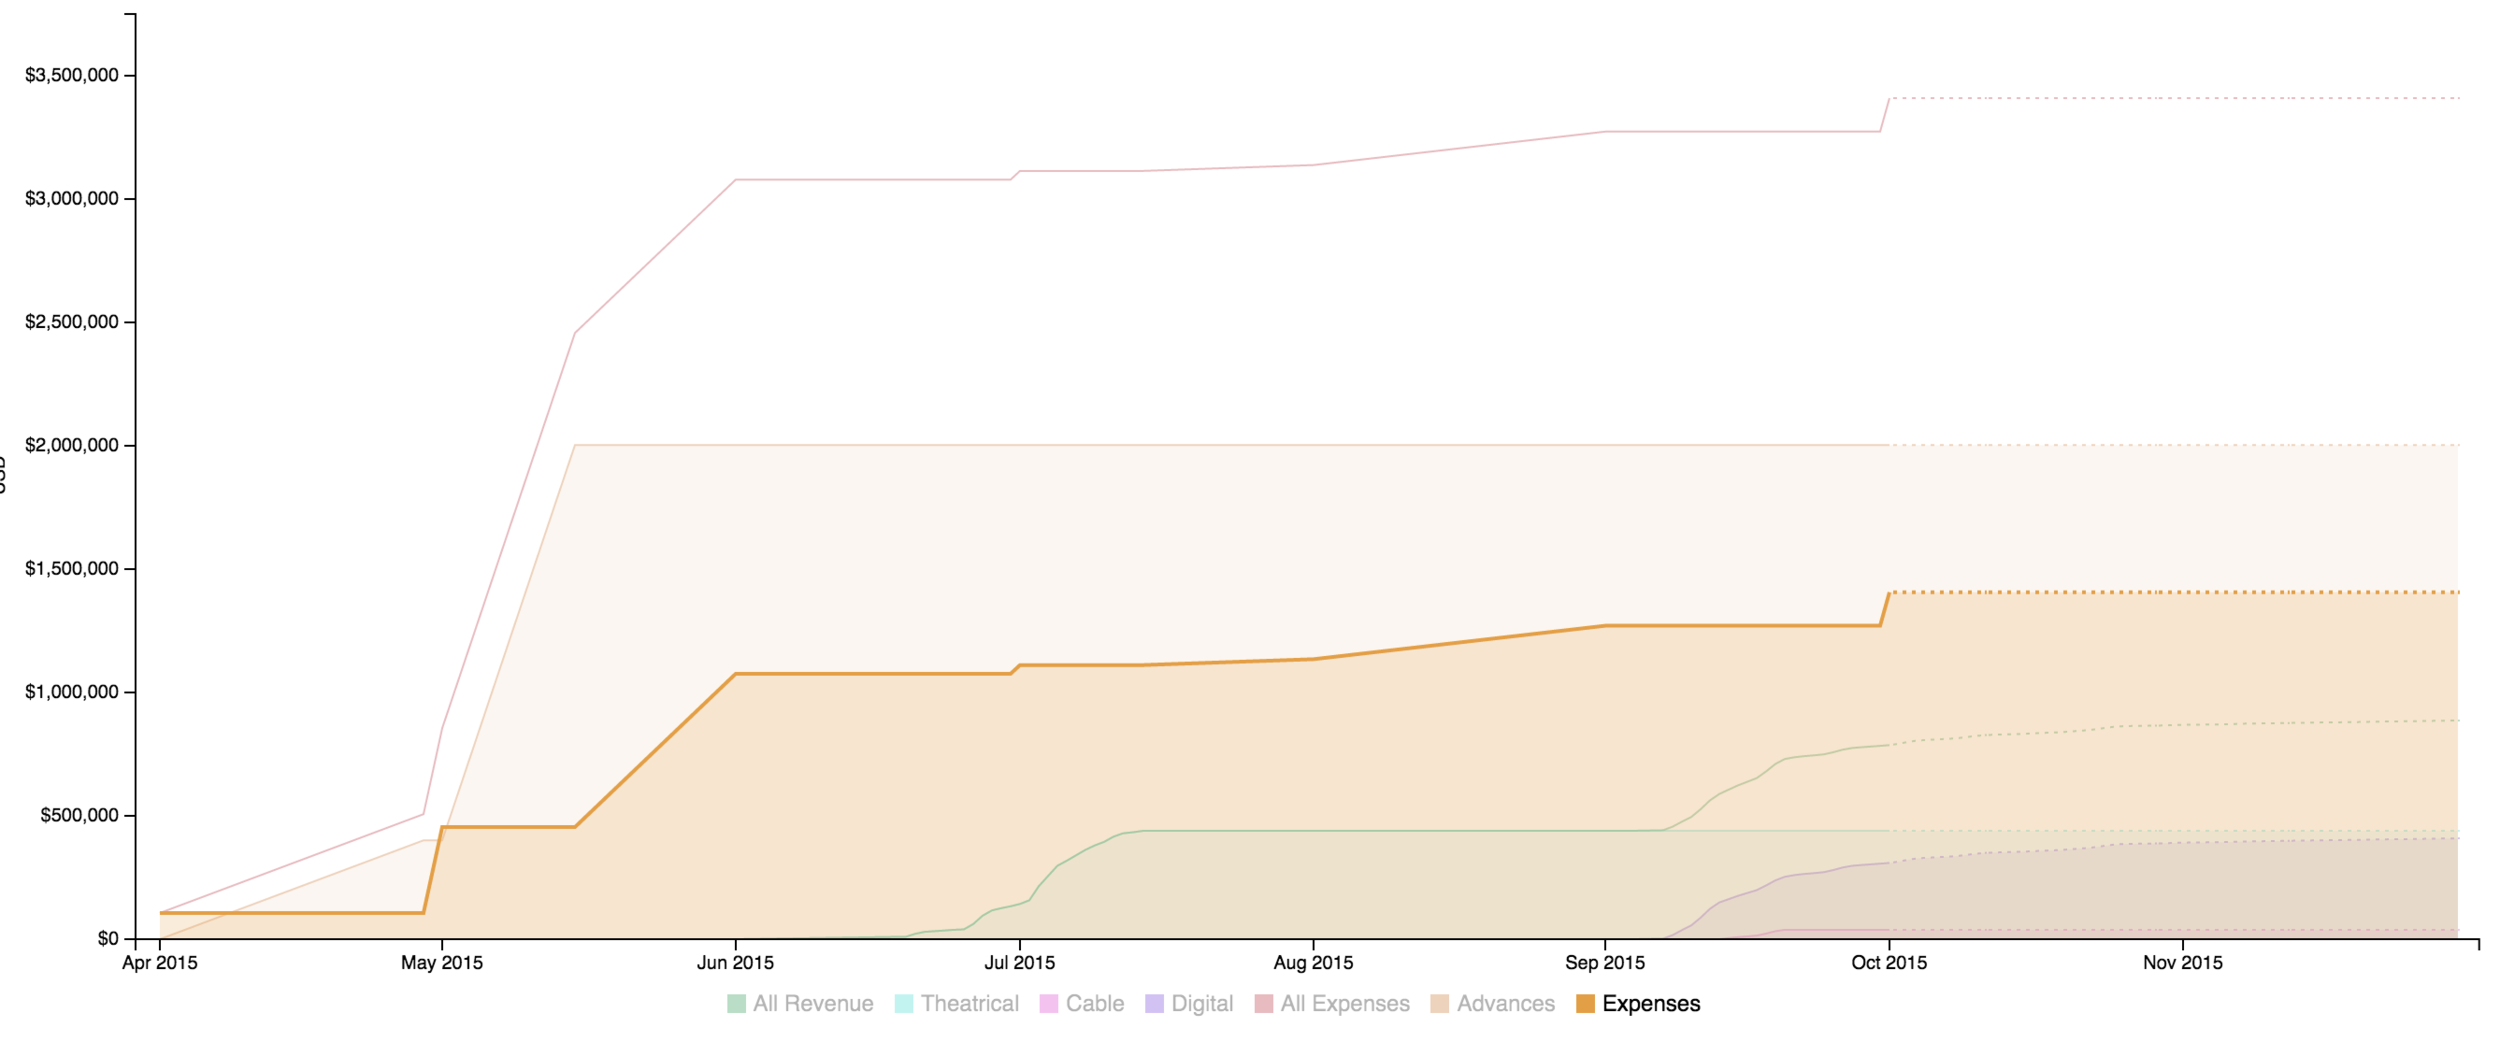
Visualization Goal
- Render multiple revenue types on the same graph
- Render the aggregate (i.e. Revenue) on the same graph
- Render expenses and advances on the same graph
- Render “projection” lines differently from real analytics transaction data
- Display the P&L values at each date
Film Revenue Data Characteristics
- Only a handful of new Film clients every year
- One film (release) per client
- Films are released theatrically (sometimes), on cable (most of the time), and digitally (always)
- Release windows can be staggered and/or overlap
- Lifetime performance of film
- Multiple dimensions of interest, including:
- store, country, format, market, transaction type
Factors Impacting Volume of Data
- addition of new data feeds
- introduction of new transaction types
- lifetime of a film is different from the currently observed lifetime of our film/tv business
- acquisition of majorly profitable titles
Comparing Data Stores: Aurora vs. PostGRE SQL
Given the large amount of data feeds which need to be supported, the team needed to review our data store options. Our current store PostgreSQL versus a new option Aurora.
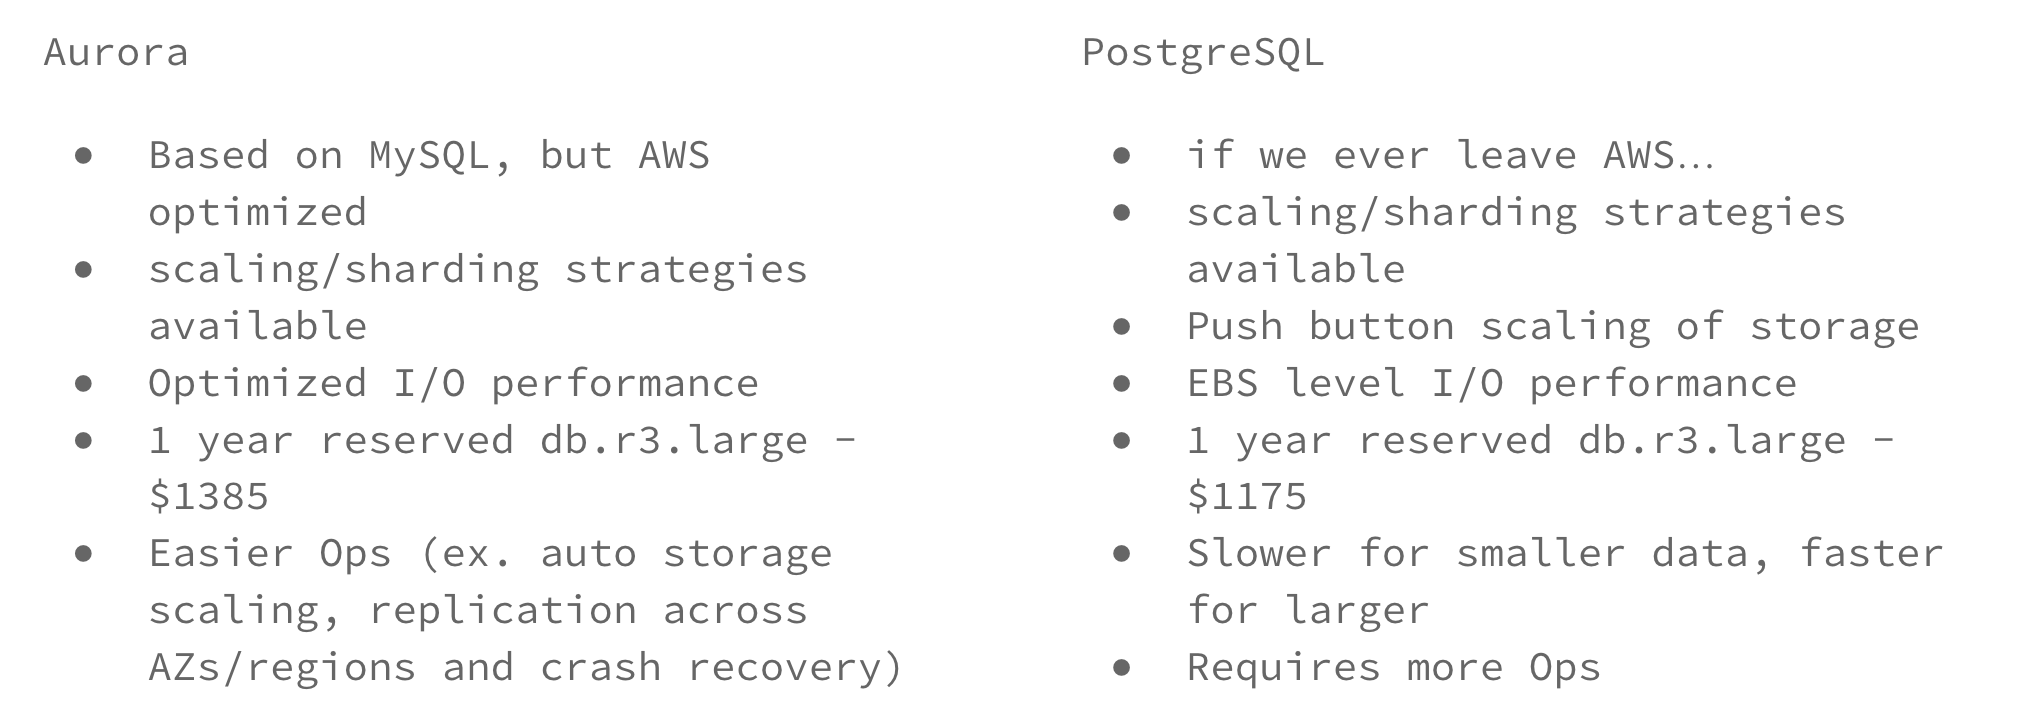

Aurora won and so the proposed data flow would be:

Spike Results
DELIVERABLE 2: Completion of Film Transparency Phase 1
Overview
With the completion of the spike, there was now a clear path forward on how to proceed with the MVP of this product. The first phase of the Revenue Forecast Tool will be the first launchable release for clients. Goals in this phase include:
- Create the Revenue Forecast Tool as a new Analytics product in the Workstation
- Tool should provide clients with revenue data for Digital, Cable, Theatrical, and Term License transactions
- Tool should provide clients with revenue projections per transaction type
- Create an admin tool for internal users to upload Theatrical, Term License, and Cable revenue data
- Create an admin tool for internal users to set a revenue projection schedule across Digital, Cable, and Theatrical revenue streams
REQUIREMENTS
In order to provide the team with clearest path forward, the following requirements were specified.
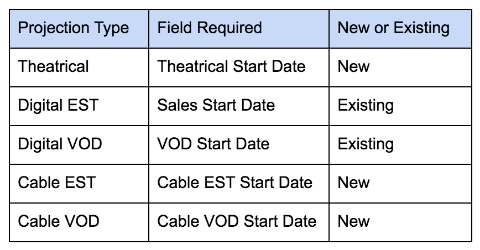
Projections
- Internal users will have the ability:
- To manage a film’s performance projection over time
- To set a unique decay rate per week for the following: Digital EST, Digital VOD, Cable EST, Cable VOD, Theatrical
- To set a 26 week decay rate schedule
- Tool should have a bulk upload for client managers to set schedules in spreadsheets
- To view actual “weekly” revenue as it is available. Weekly to be defined by Start Dates on the Release level for the following revenue streams
- Once a week has passed, that week becomes disabled and the page should display the actual revenue received for that week as well as the true decay rate that occurred.
- To see their decay rate applied to the last actual week of revenue (or recursively to the last actual week of revenue), while they are modifying a film’s decay rates
- After 26 weeks, the user will be able to set a percentage of total revenue that should be applied to the film until the contract term expiration date. Example: In its first 26 weeks, The Overnight received $50,000 in Digital EST revenue and $50,000 in Digital VOD revenue. To project Digital revenue from Week 26 until the film’s expiration in 2024, the client manager will enter a percentage of that revenue to be applied till the end of rights. So, a 10% rate means we expect $5,000 revenue for EST and VOD over the next 8 years.
- The lifetime decay rate should always be editable and will be available for each channel
General Visualization Guidelines
All-Time Values
Regardless of Time Filters, show:
- Total Revenue to Date
- “Contract Projections” (i.e. factoring in signed licenses)
- Total Projections (i.e. factoring in unsigned licenses)
Graph Region
- Cross-hairs (see Yahoo Finance) should appear when cursor hovers over graph. A label should appear over the x-axis to indicate the date (week/month, etc). Two labels should appear over the y-axis to indicate the actual/contract revenue, and to indicate the projected revenue.
- The graph area indicating the future should be shaded.
- X-axis and Y-axis gridlines
Time Scale
Lifetime view of revenue should be the default
- Duration of a lifetime is 20 years
- Each point in this visualization will represent a month of revenue
Up to 8 weeks view of revenue
- Each point in this visualization will represent a day of revenue
Up to 1 year view of revenue
- Each point in this visualization will represent a week of revenue >1 year view of revenue
- Each point in this visualization will represent a month of revenue
Filtering by Date
There are two mechanisms to filter by date:
- Presets
- Visual slider tool (brush)
Presets
Week, Month, 3 Months, 6 Months, 1 Year, 3 Years, All
- These are time ranges, not necessarily start/end dates.
- Need to decide how to refresh when someone changes the preset
Visual Slider Tool
See Google Finance and AOL Daily Finance (less slick))
- Displays full curve of actual (and total projected?) revenue
- As user moves grab bars or slides the window, the date updates to reflect what is in the slider tool
Revenue To-Date Visualization
Revenue to-date should be depicted as a solid line.
Hoverbox
When the cursor is over a past date, the following hoverbox should appear, with cumulative actual revenue, by transaction type:
- Total Revenue
- EST
- VOD
- Cable EST
- Cable VOD
- Theatrical
- Term License
- Airlines
- Physical
- Free TV
- Non-Theatrical
- Educational
Projection Visualizations
There are two types of Projection lines - one solid, one dotted. Digital/Cable/Theatrical and Unsigned License projections should be aggregated as the dotted line.
Digital/Cable/Theatrical Projection Visualizations
- Values must be shown in the hover box
- Digital/Cable/Theatrical projections should be represented with a dotted line
License Projection Visualizations
- Values must be shown in the hover box
- Signed (closed) contract license projections should be represented with a solid line
- Unsigned license projections should be represented with a dotted line
Hoverbox
When the cursor is over a future date, the following hoverbox should appear, with cumulative actual and cumulative projected revenue, by transaction type.
DELIVERABLE 3: Film Transparency Prototype Press Release
Overview
With the first phase of the Video Retail’s Film Transparency project anticipated to reach users in Q4, we are looking to present a version of our product to the market within Q2.
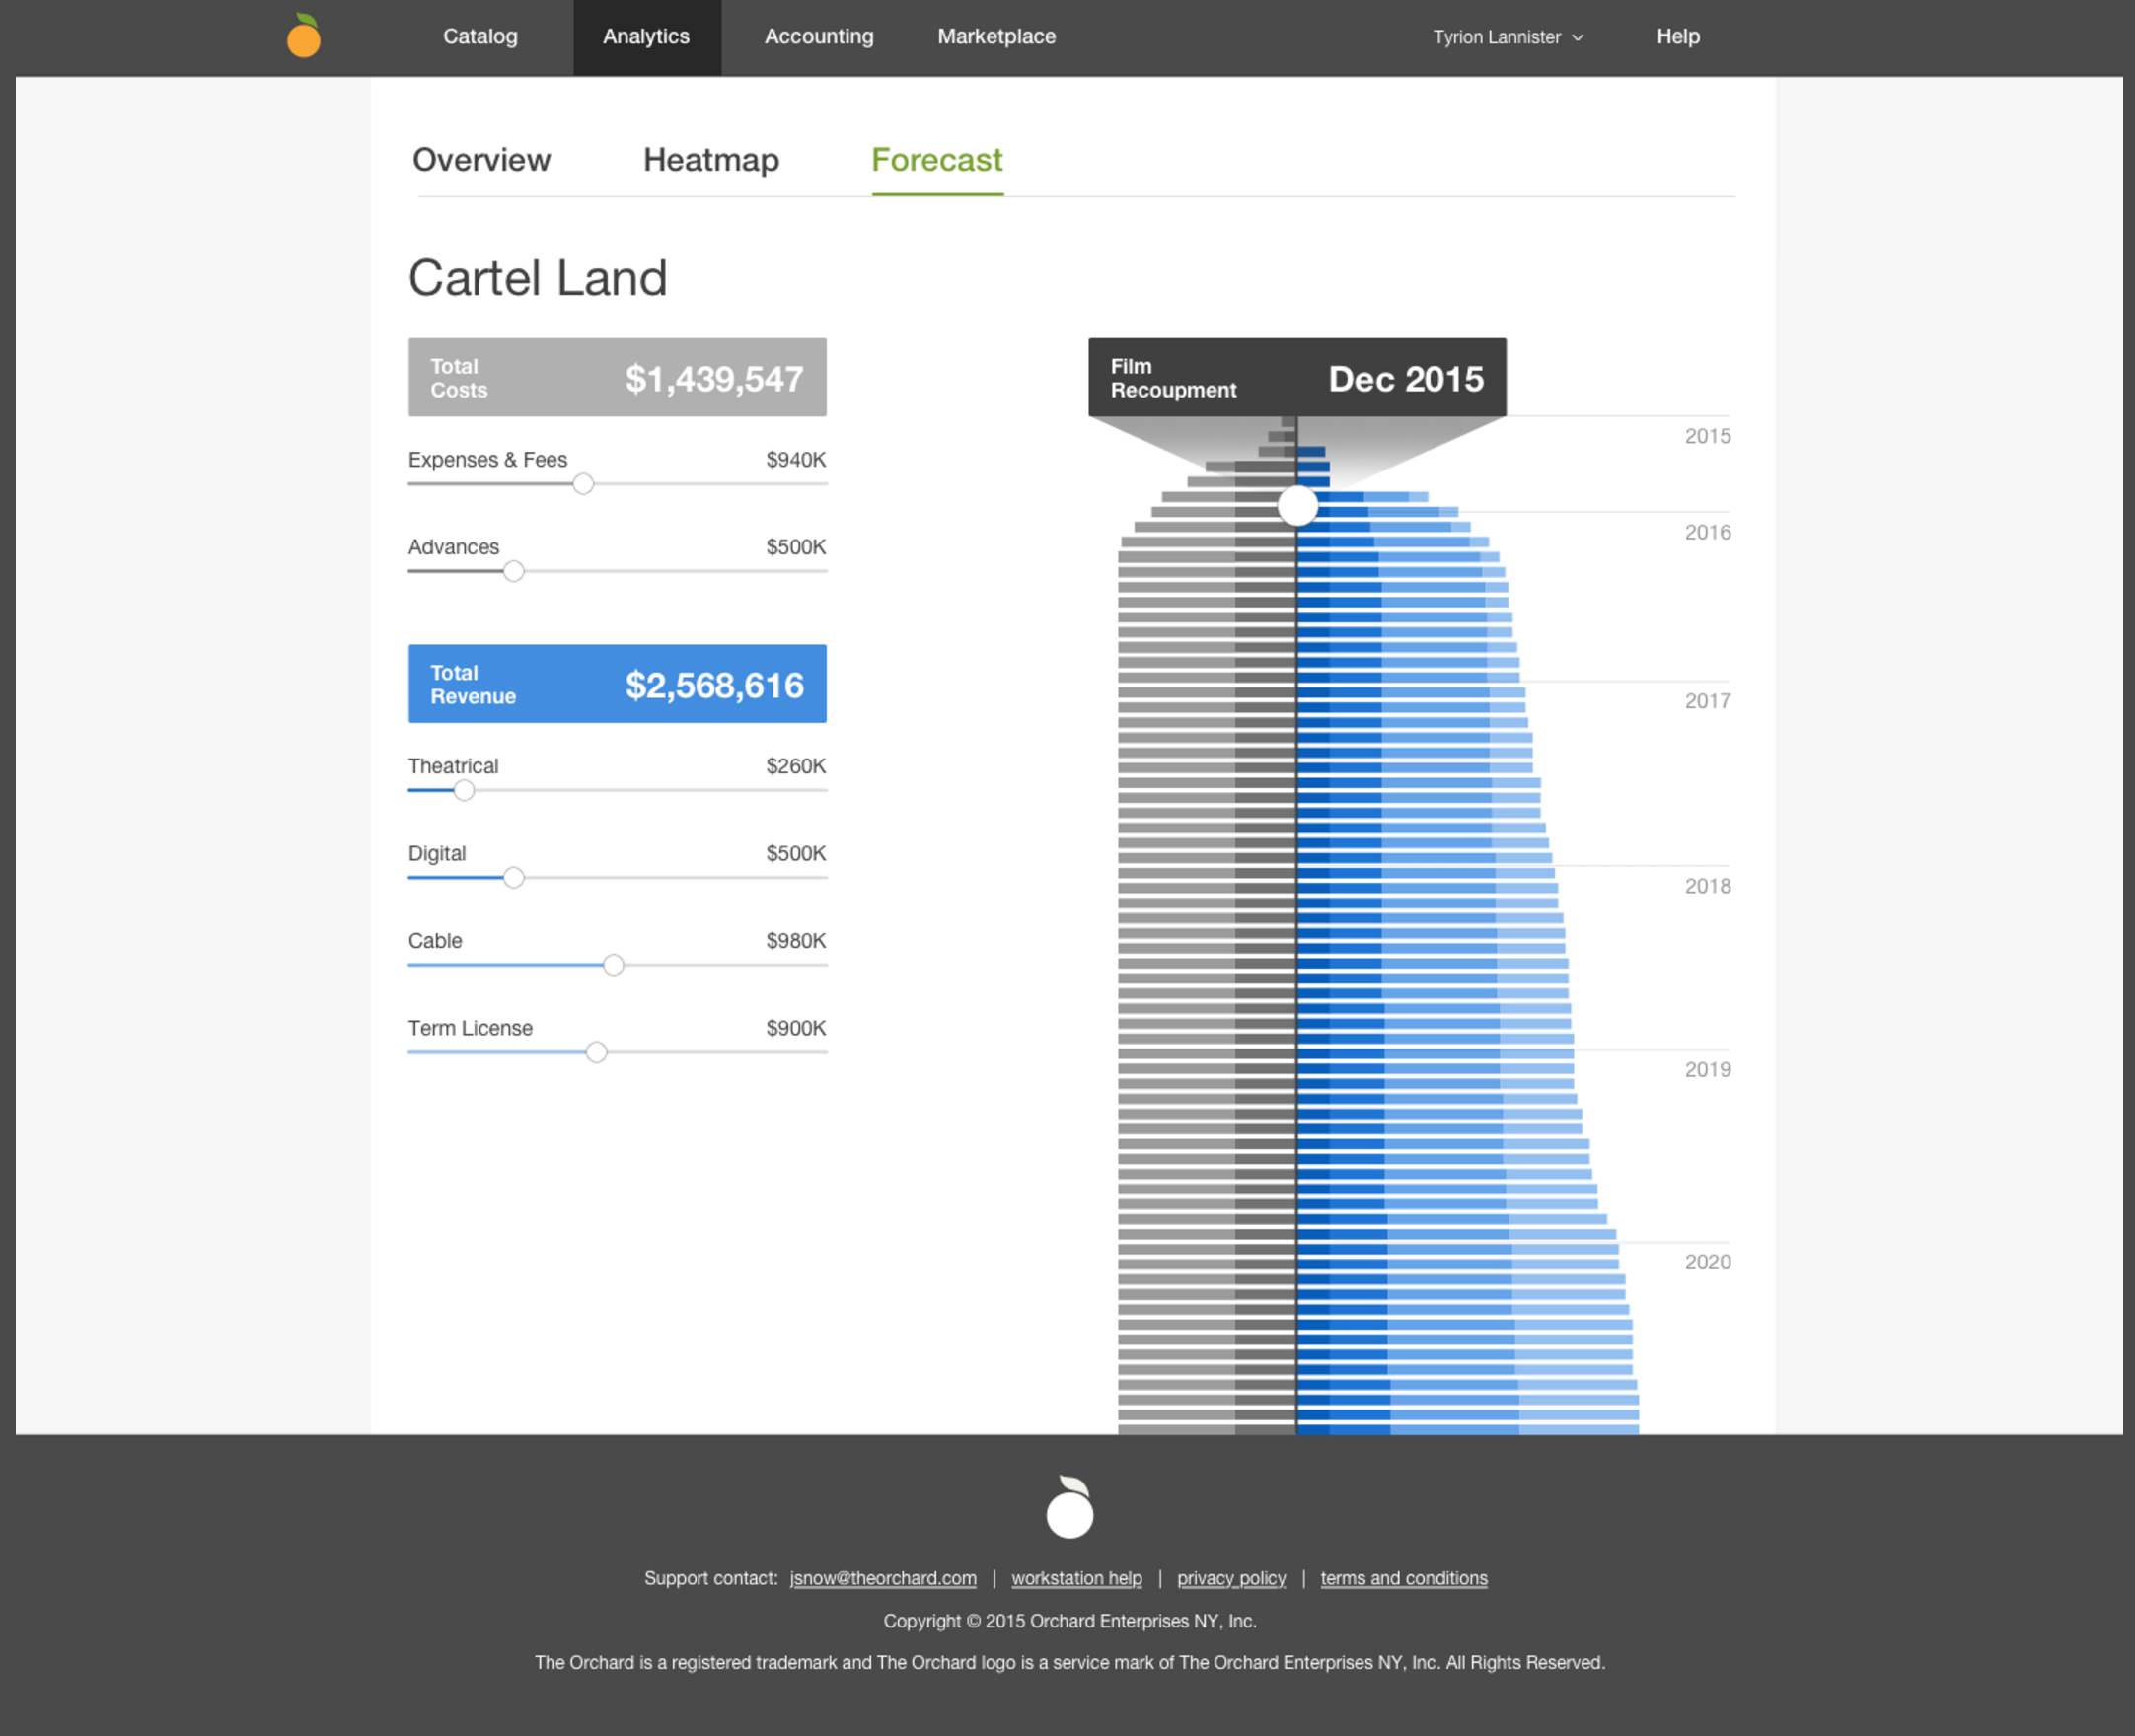
Assumptions
- By putting a prototype of the Film Transparency tool out to the industry, we will be positioning ourselves further in the market as being the only distributor actively working on revenue transparency.
- Announcing the Film Transparency product several months earlier than our actual Phase 1 release will not compromise the product from being copied by competitors due to The Orchard’s technology advantage - i.e. no other Film distributor is as invested in technology
Use Case & Necessary Components
“As a Film beta user, I want to see if this given film will recoup and what variables can be adjusted to gauge if it will”
- Standalone prototype outside of the Workstation
- Graph that contains the following:
- Aggregate Digital, Theatrical, Cable, and Term License revenue data over time
- Projections
- Date Selector - down to the day
- Recoupable Fees/Charges
- Expenses
- Advances
- Distribution Fee
Prototype
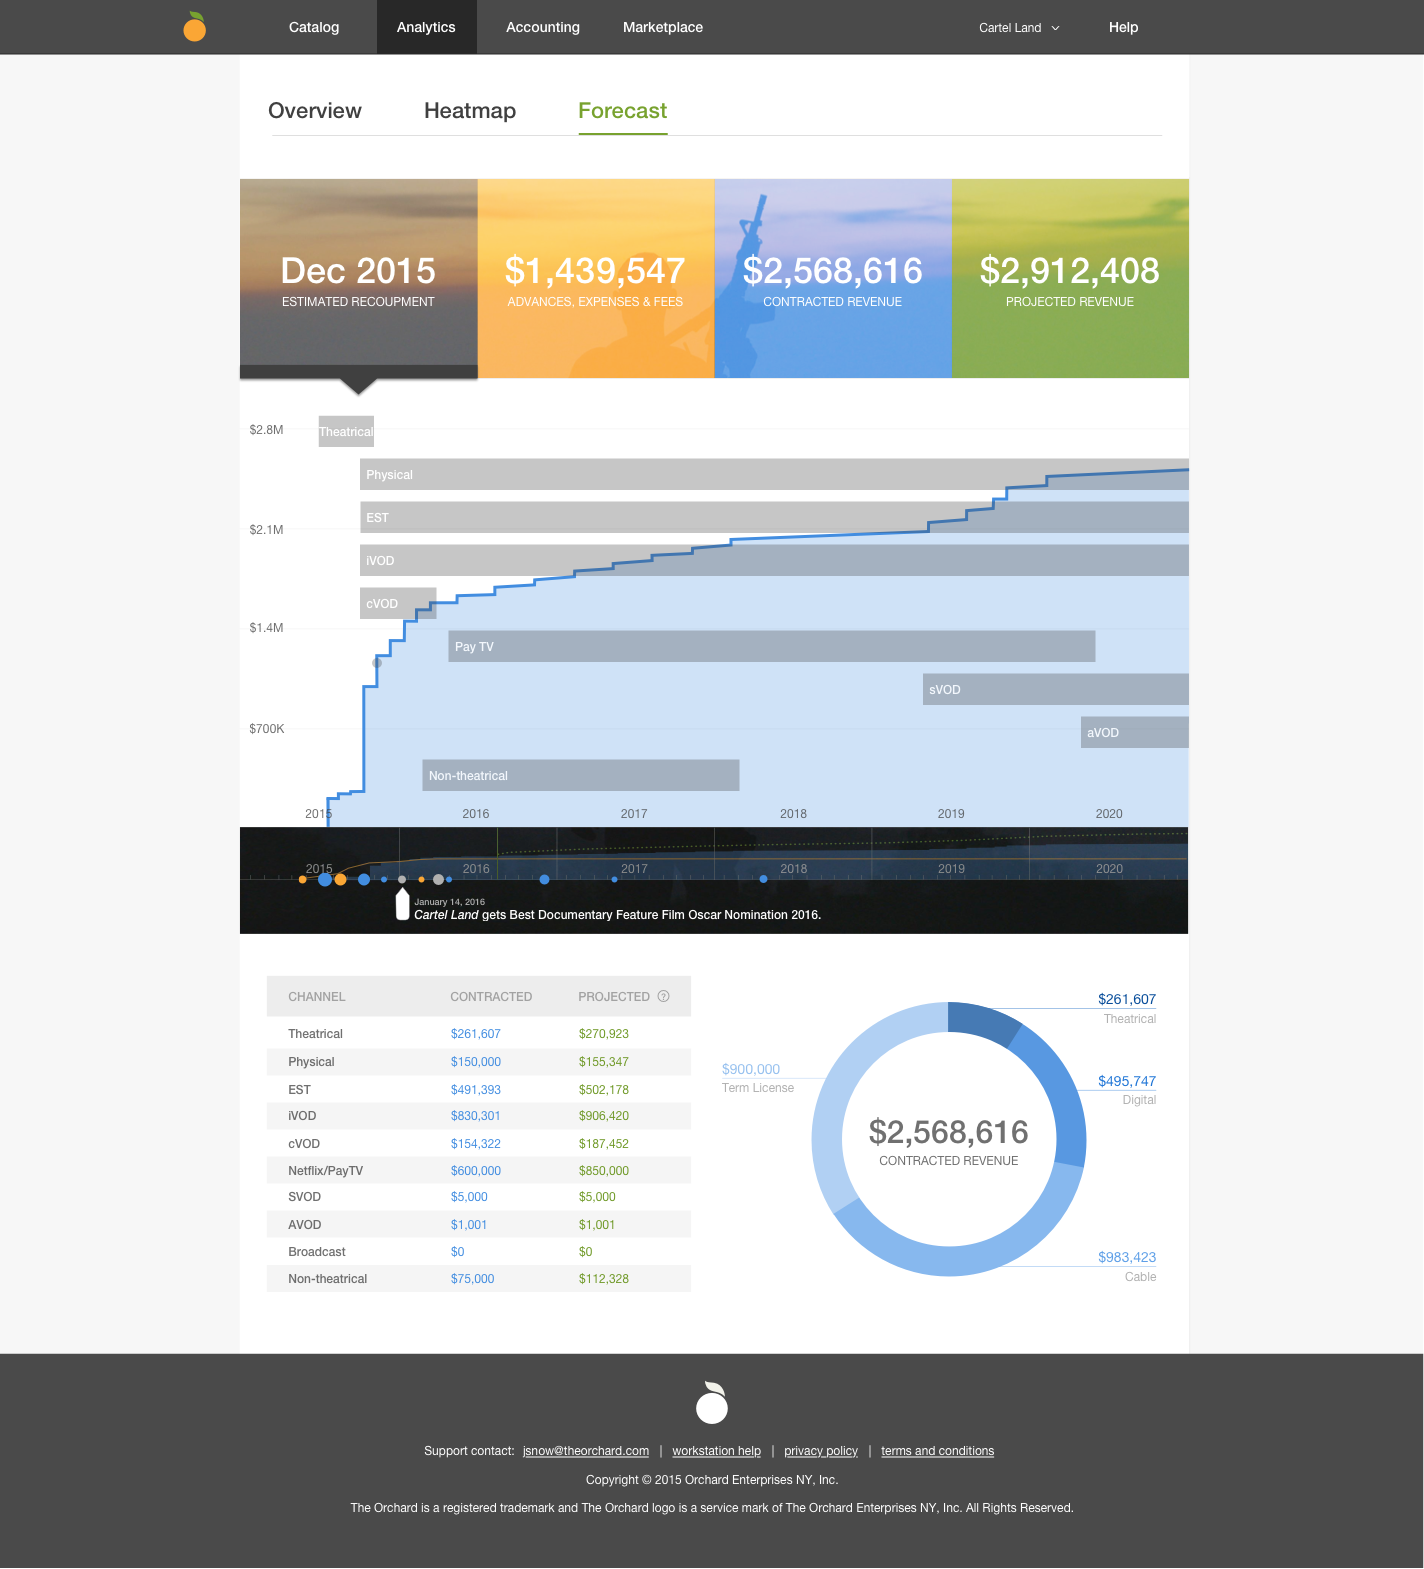
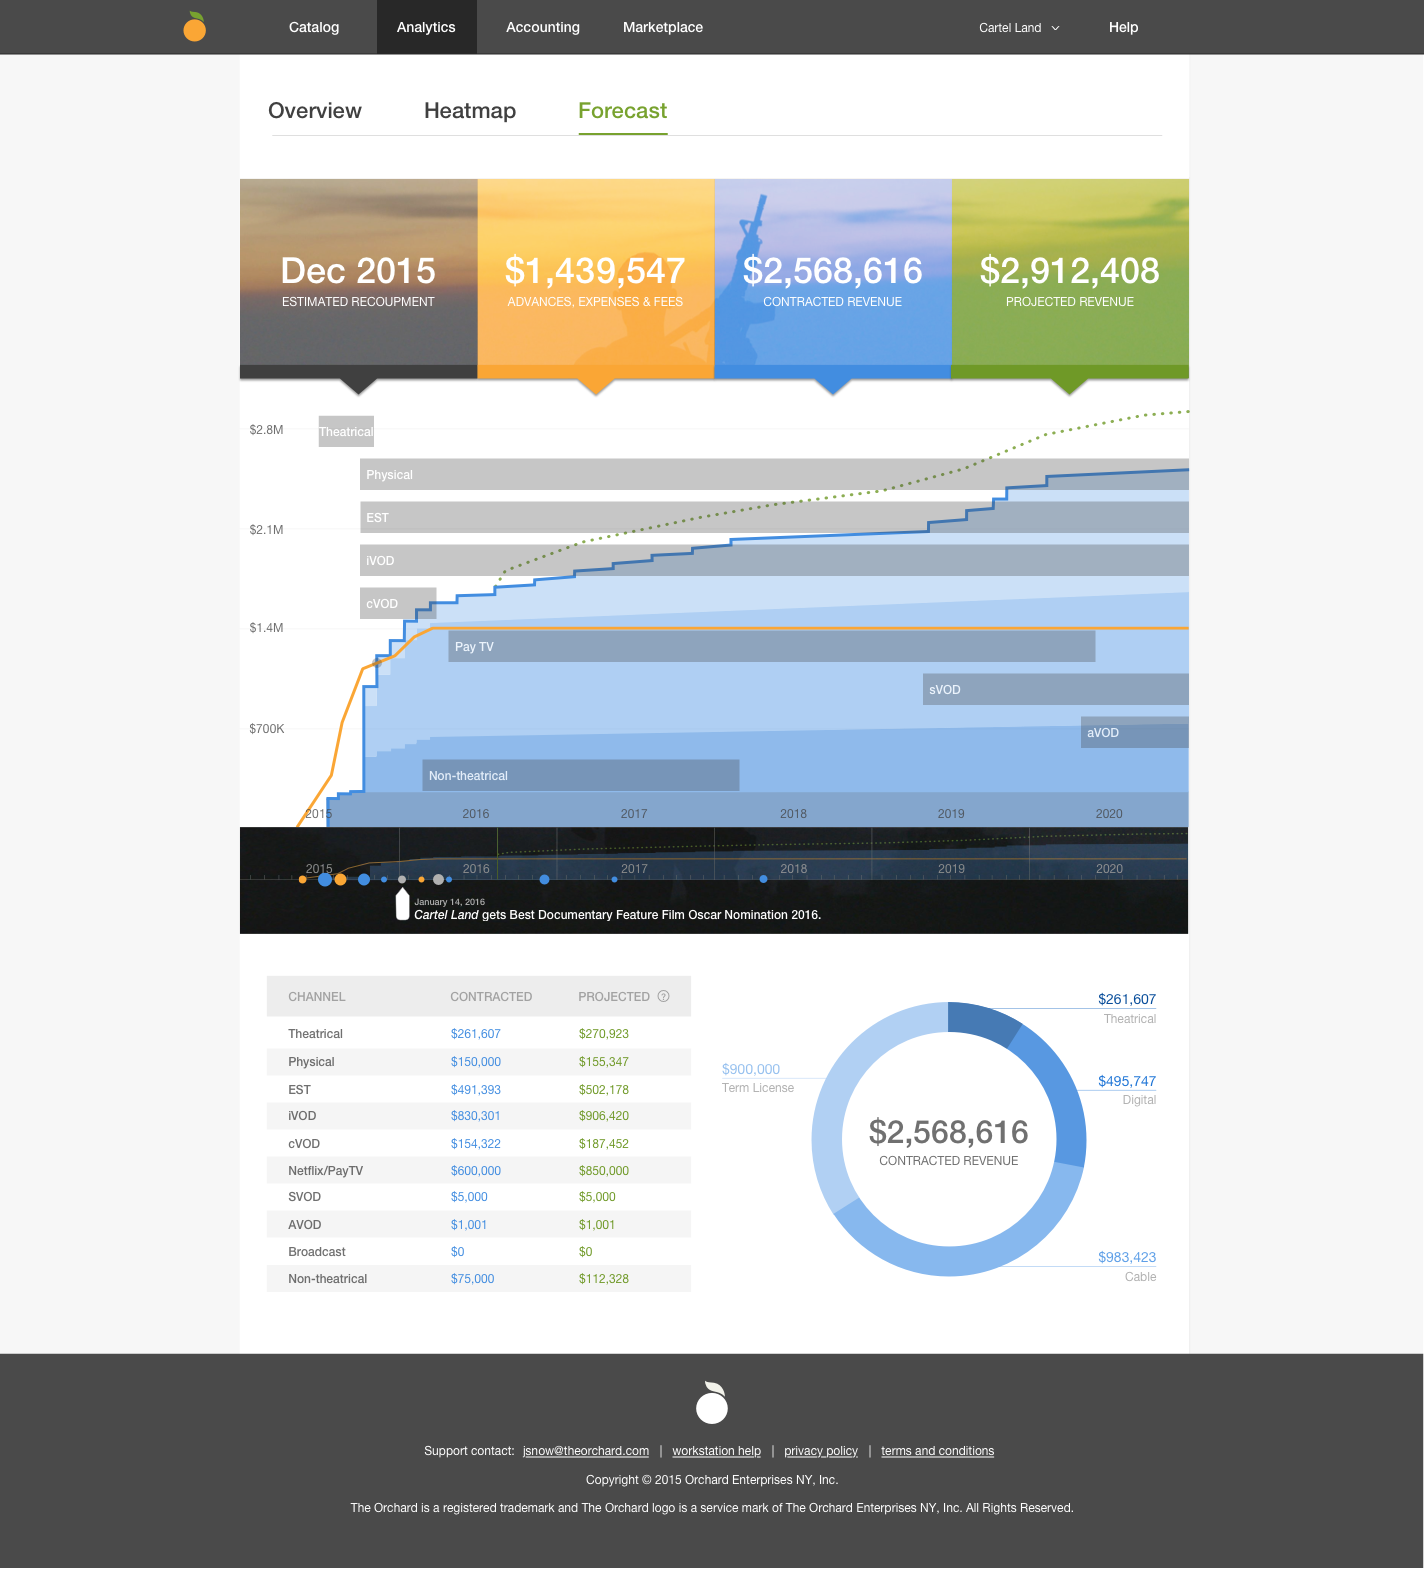
This prototype blends an Orchard film’s accurate performance with the ability for end users to do some data modeling on their own. We aim to use the true numbers behind our film, Cartel Land, and populate our prototype with true revenue, expense, advance, and distribution fee data. From there, users can experiment with variable manipulators to gauge different performance outcomes.
PROS: The impact of using a high profile film’s true performance, very interactive
CONS: May be difficult getting legal signoff
User Job Stories - Stakeholder Exercise
Purpose
To further solidify understanding of the film transparency mission, and shape the direction and road map of the revenue forecast tool based on user needs.
- Validate initial catch-up/discovery
- Uncover stakeholder insights
- Prioritize features
- Position press release prototype
Card Sorting Activity
There are 24 cards, each with a user job story expressing a situation, motivation and desired outcome from the perspective of our end users.
Part 1
Please sort these cards into either “True” or “False.” As you place cards into the “True” category, organize them into the provided buckets of importance as it relates to The Orchard’s role in solving these needs:
- Imperative
- Very Important
- Somewhat Important
- Not Important
Part 2
Create and organize additional cards of important user job stories that were not provided.
Part 3
In the “Imperative” and “Very Important” categories, order the cards from top to bottom by level of priority.
Follow-up Questions:
- Of all the cards that are at least “Somewhat Important,” which ones do you feel are already being resolved quite well in the Workstation?
- Card 01: What information would be in that distribution plan? When would it be known, and how often would it change? (e.g. windowing / release schedule, deal structure, correlation with projected revenue, planned expenses)
- Card 03: What do filmmakers consider to be the recoupment point? (e.g. the advance is paid off, the actual production cost of the film is paid off)
- Card 20: What kind of tone is involved in discussions with clients that recoupment will never be met? Are they generally aware of this before signing the deal? (e.g. anger, pressure to do more, disappointment, threats)
- Card 12: What kinds of questions do clients ask when they receive a DT spreadsheet? What kind of information and advice is provided?
- Card 10: What kind of business actions might a client take based on performance information? (e.g. promote to own audience, pressure distributor)
- Card 14: What kinds of business strategies and decisions might be made by a client based on a comparative data between revenue streams?
- Card 04: What would a client manager tell a client when they ask about why their opening balance is negative?
- Card 07: What kind of expense information do clients want to see broken down? How granular does it get?
- Are there other imperative goals for the revenue forecast tool that come from The Orchard’s perspective, but may not align with an end-user need? e.g.:
- To create a sustainable workflow by reducing the need to generate the spreadsheets to only the initial set-up of a new film.
- To solidify the claim that The Orchard is a transparent film distributor.
- To attract new film clients.
- To transform current clients into repeat clients by offering additional value.
- Of all the cards that are at least “Somewhat Important,” which ones do you feel clash with goals of The Orchard?


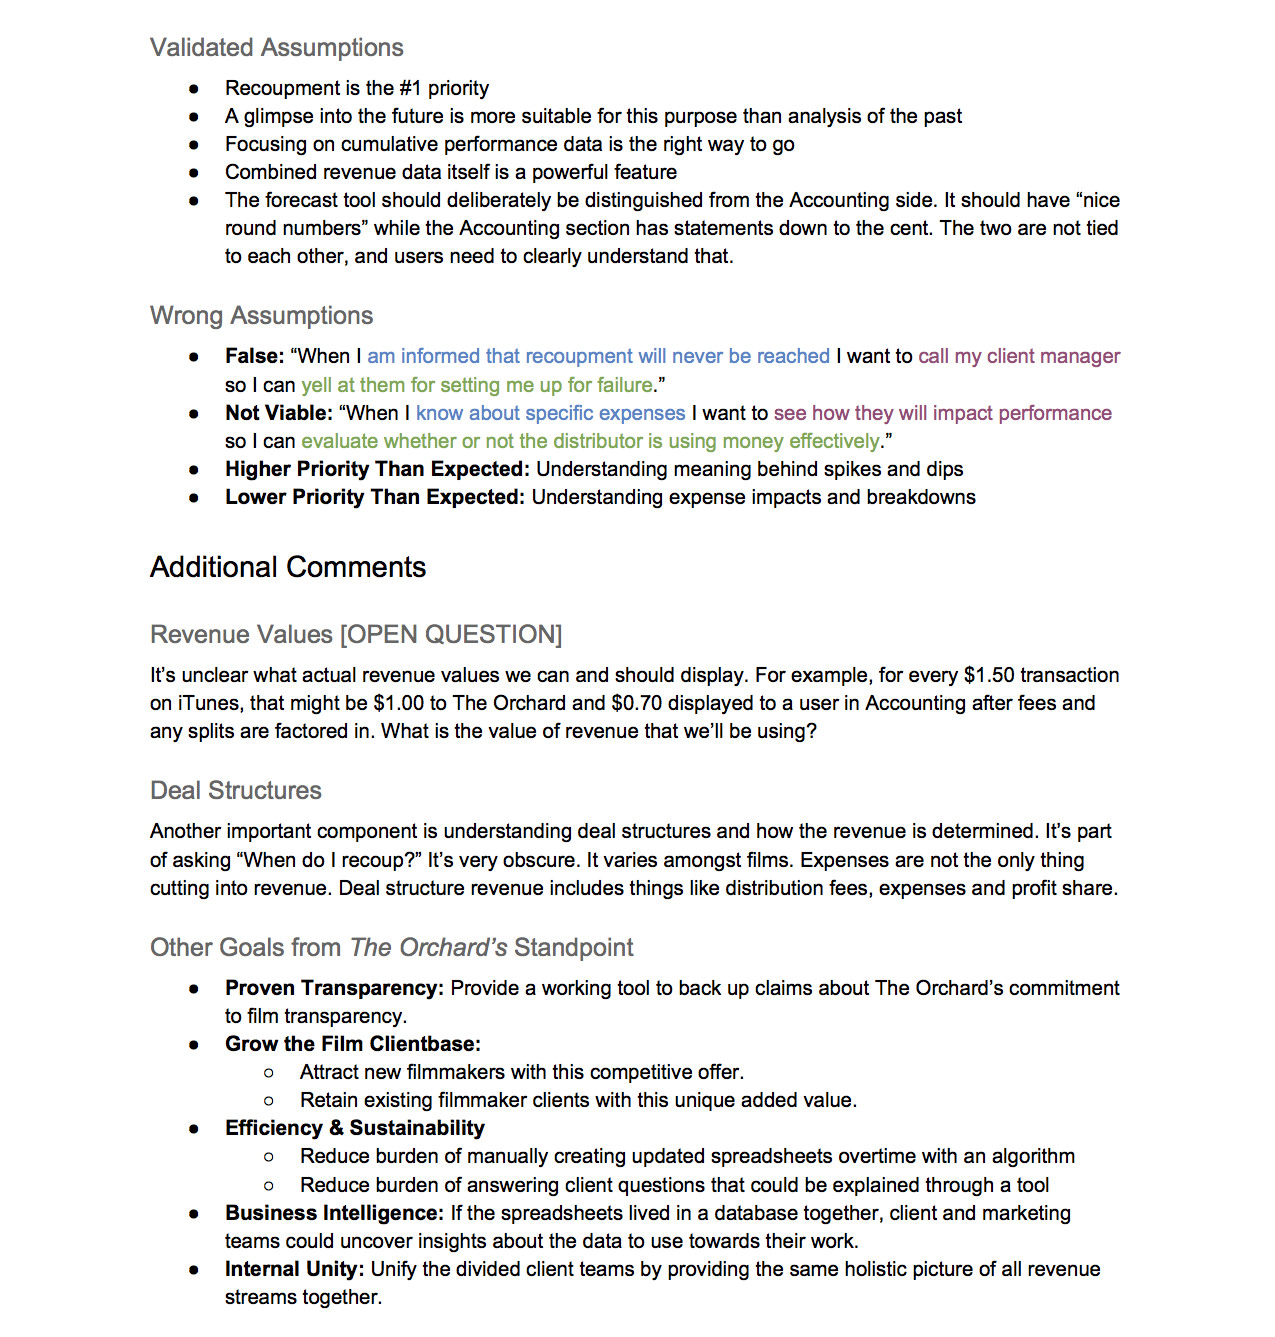
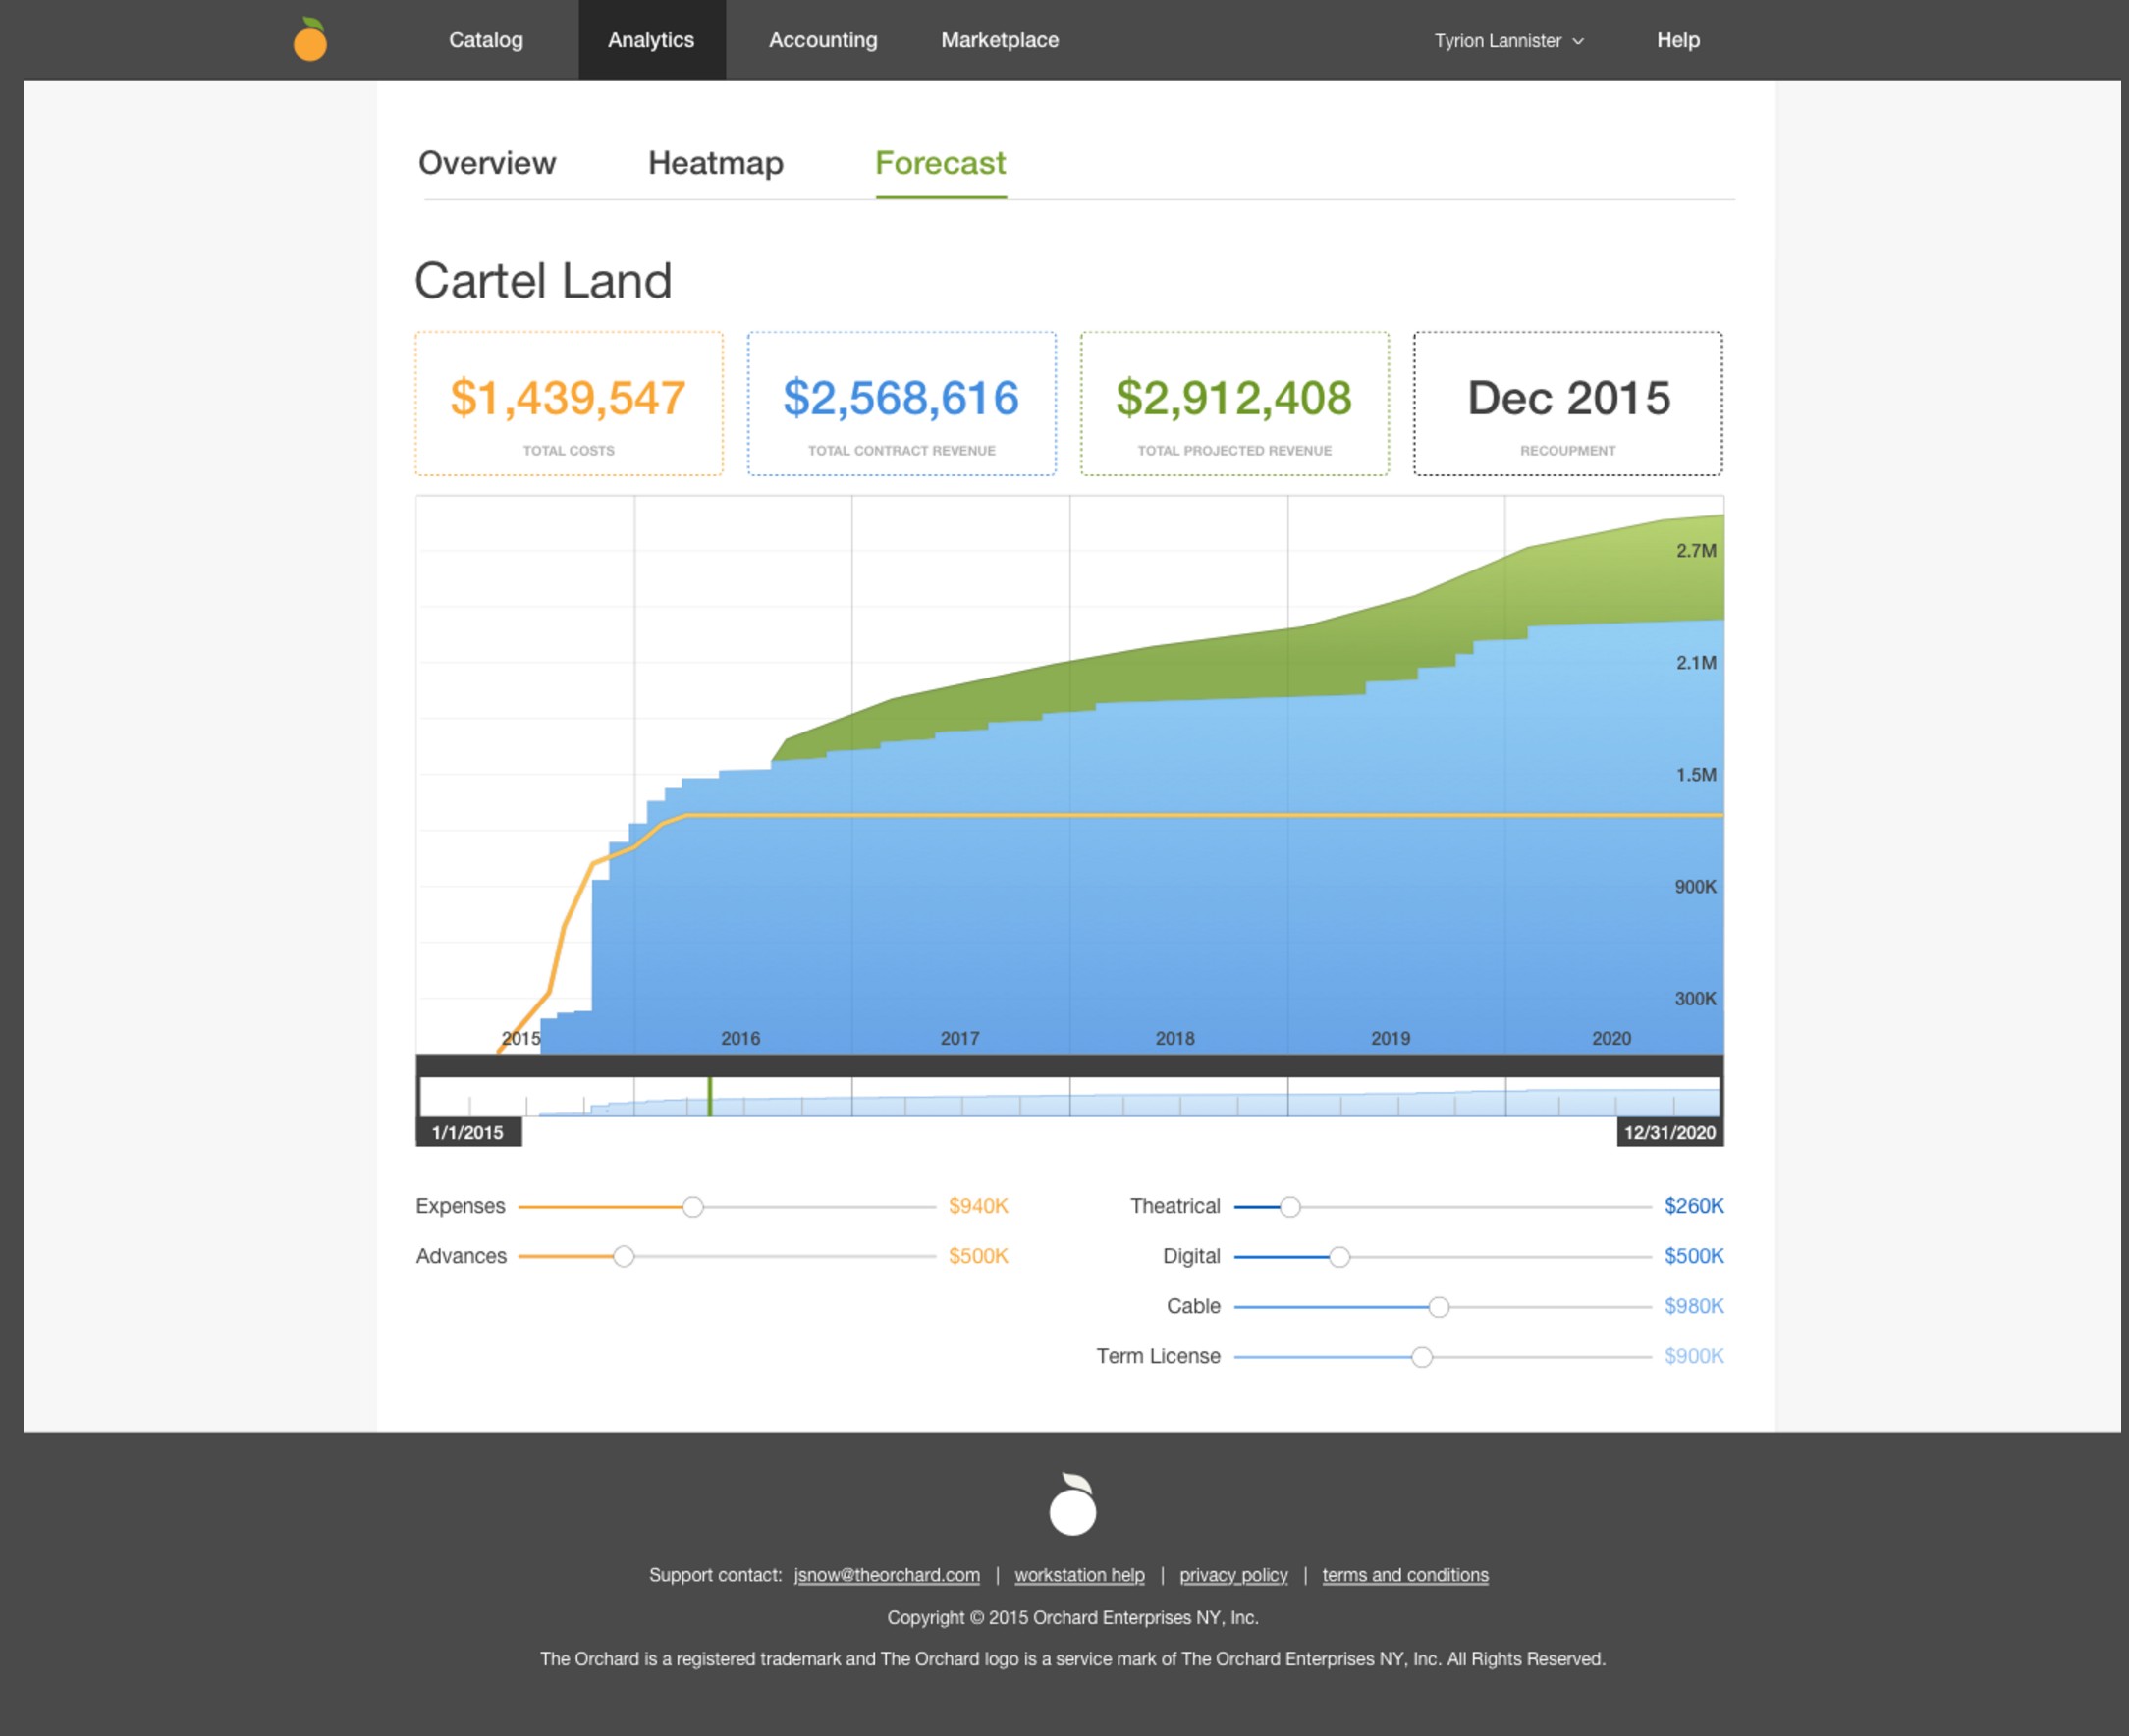
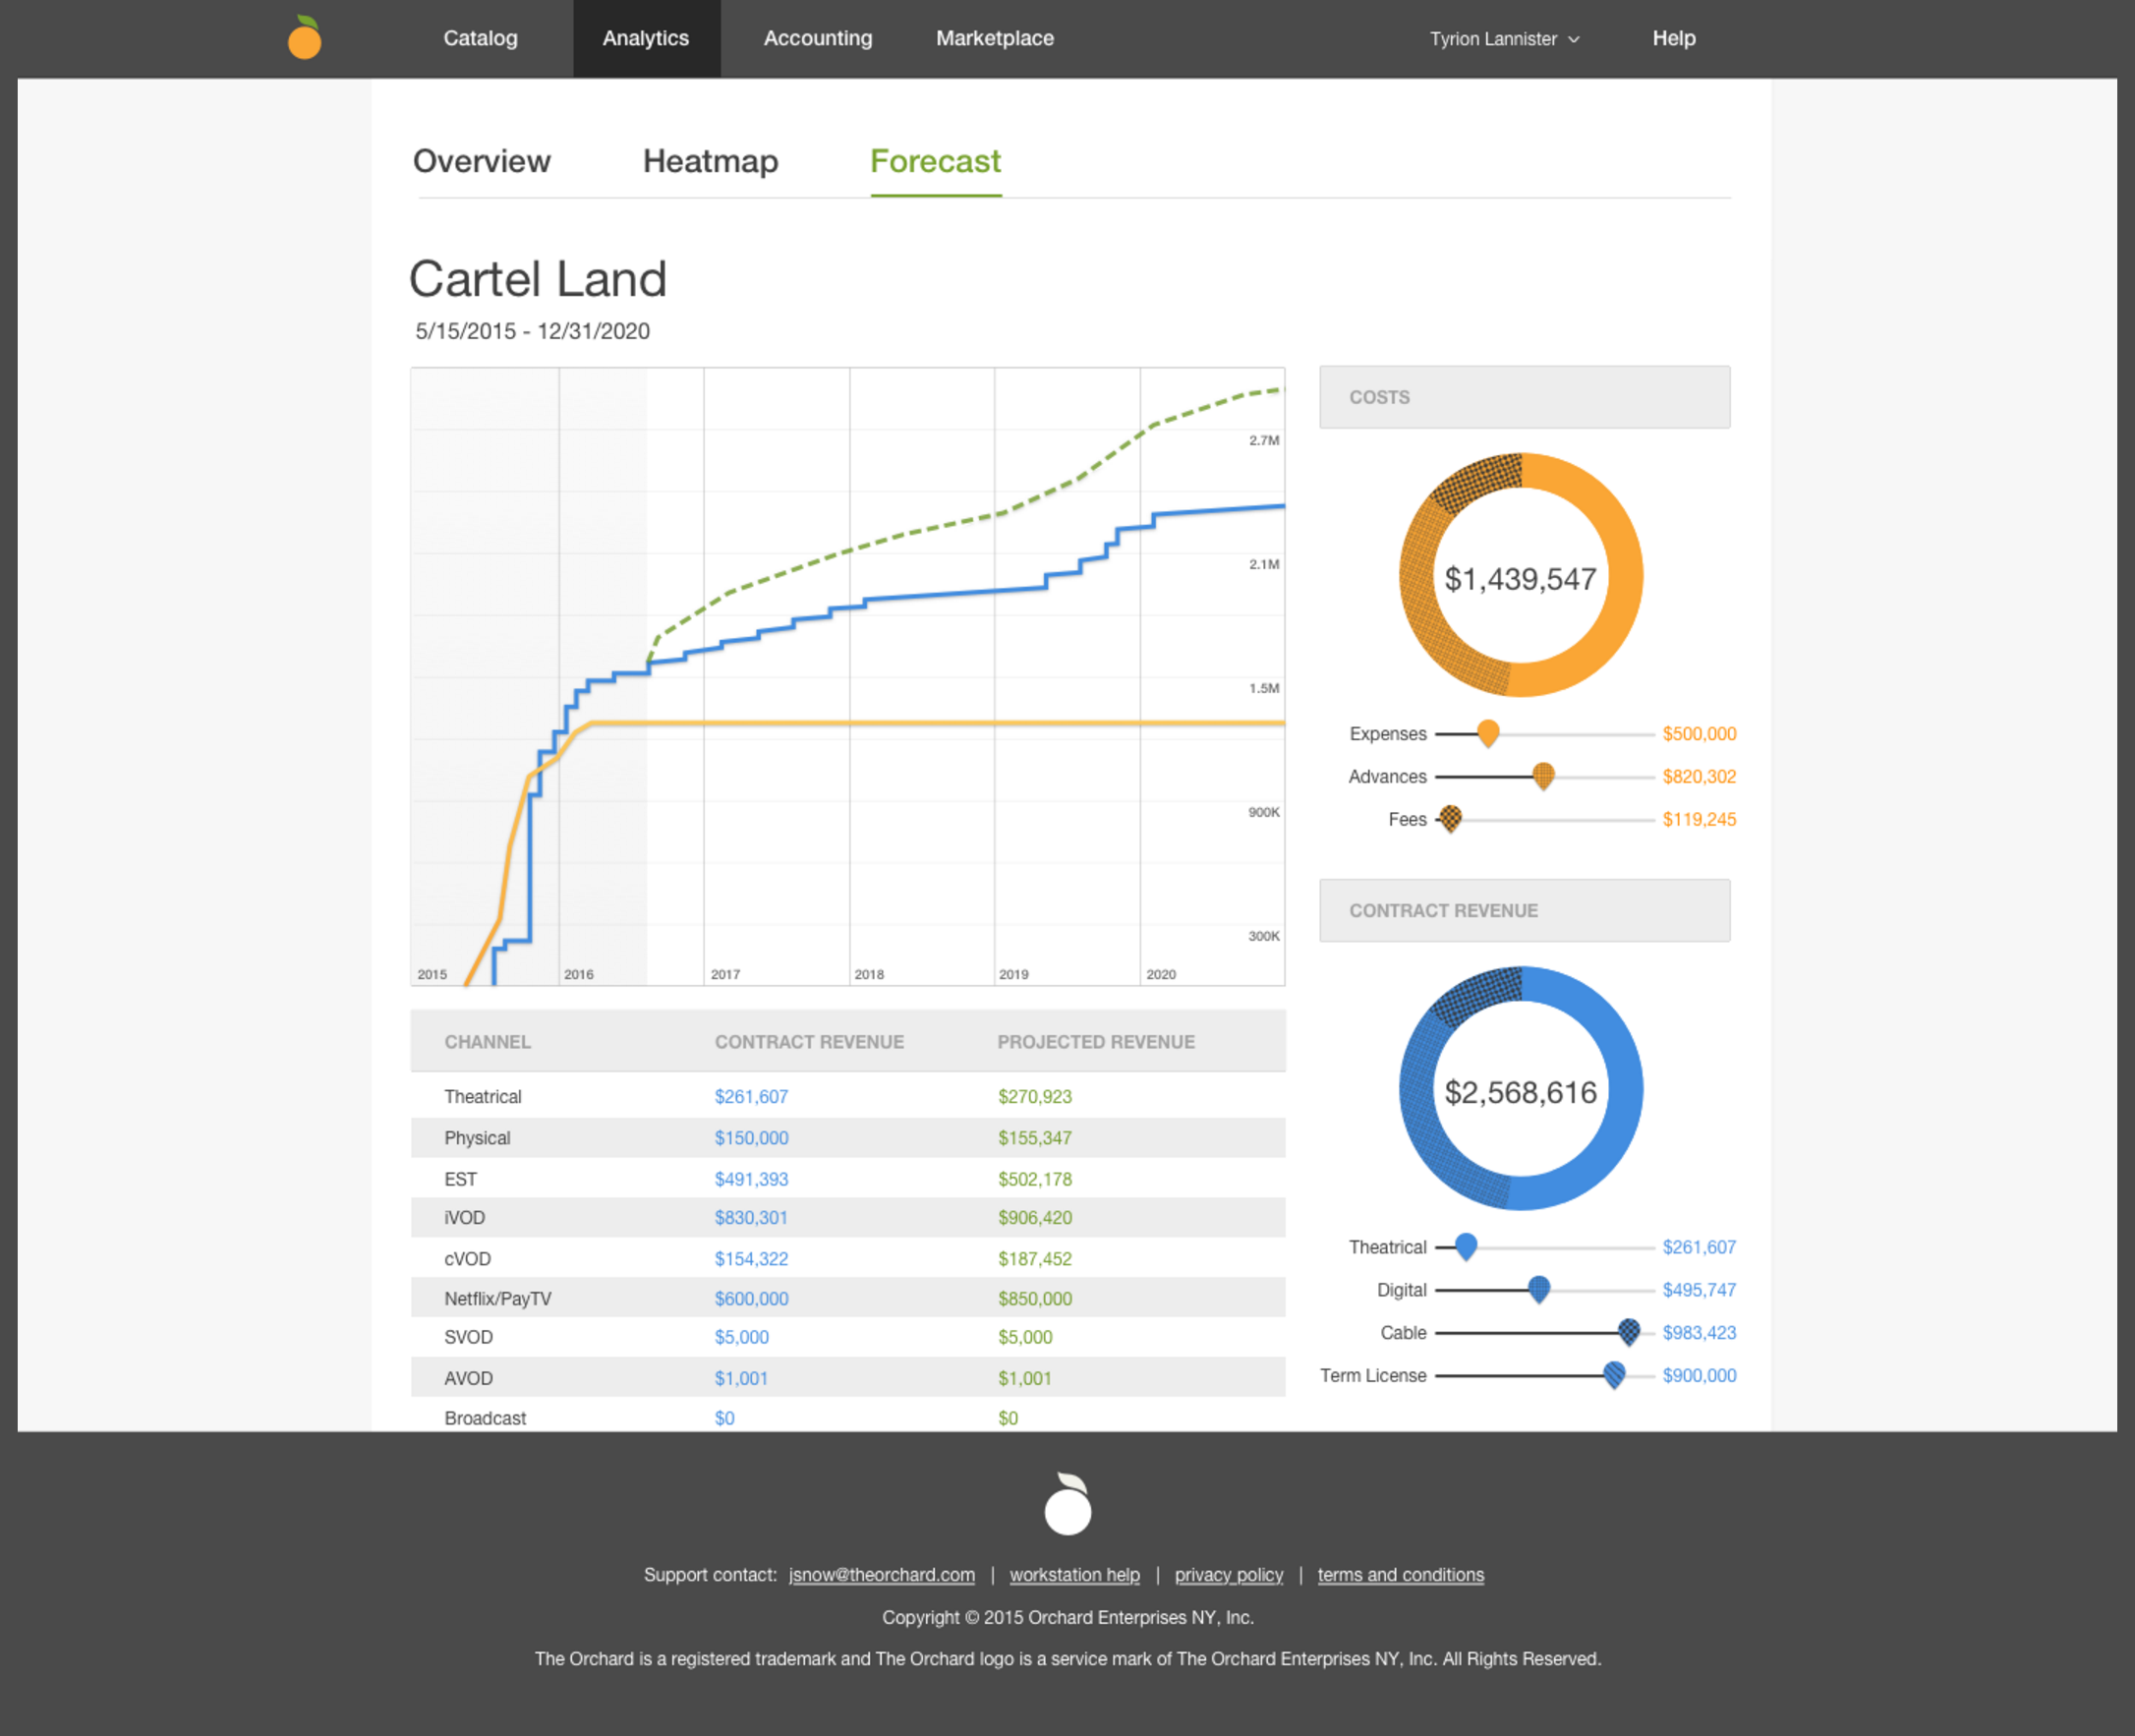
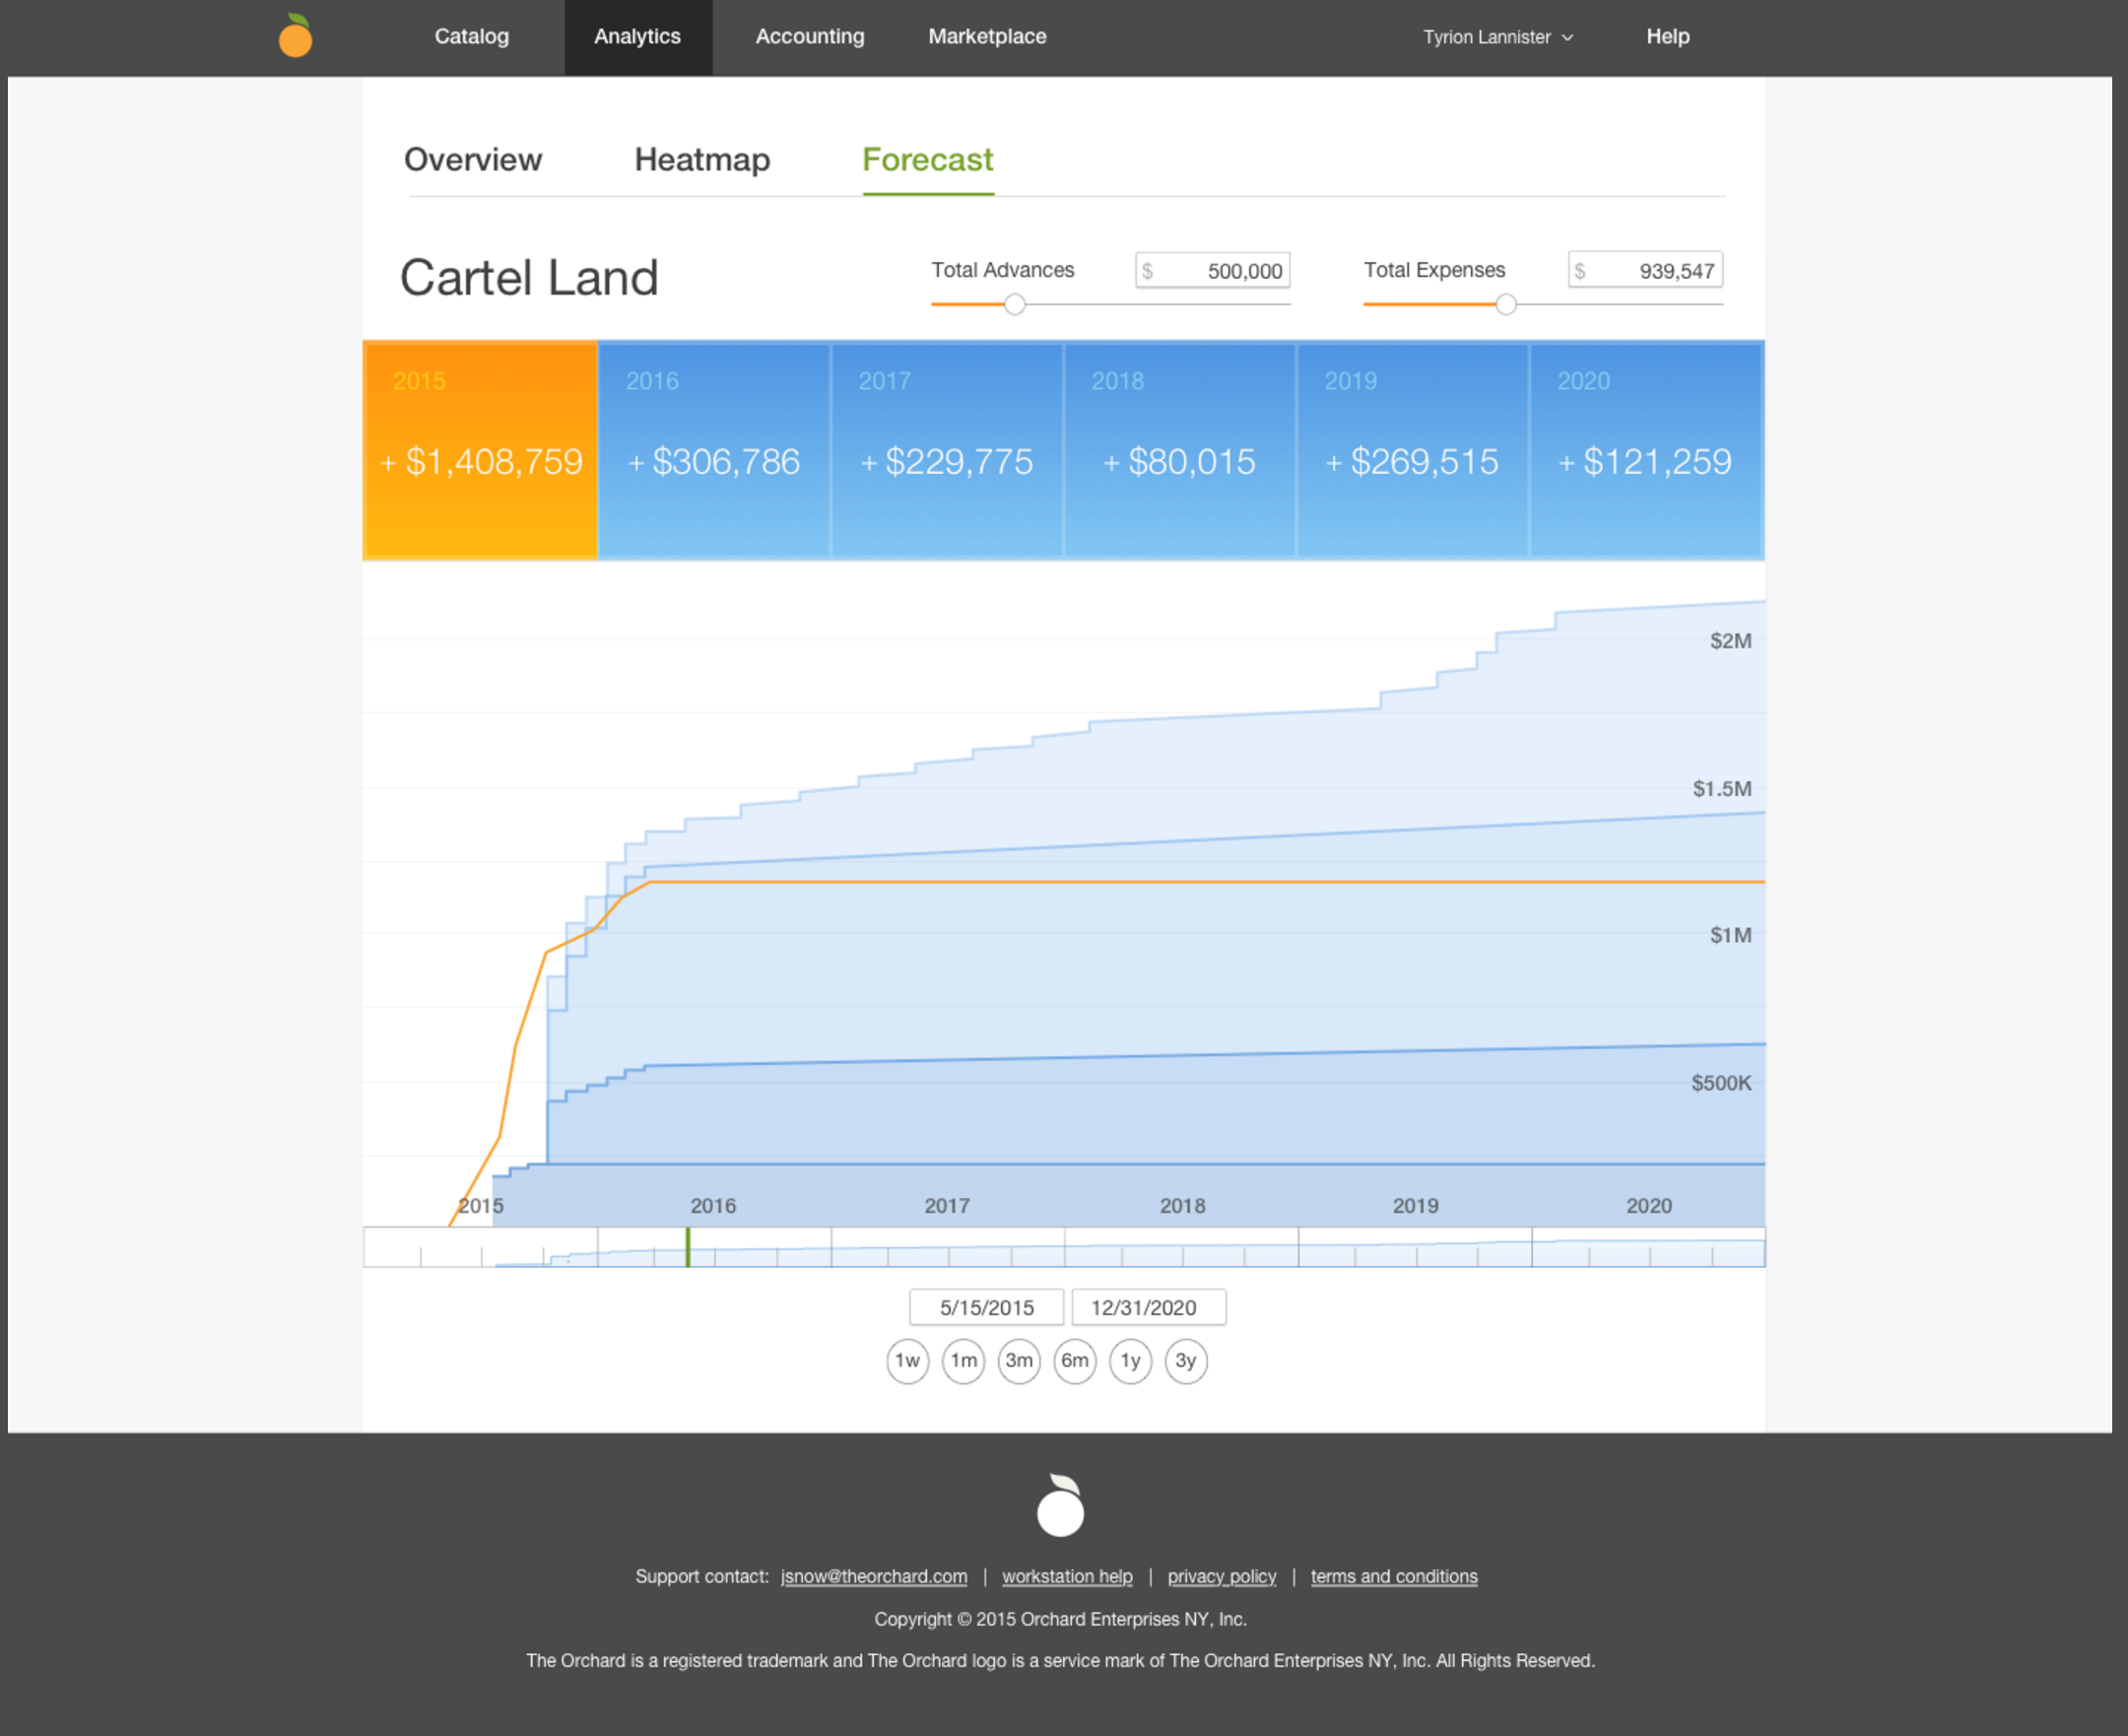
Prototype Design Requirements

- Global elements of Workstation (redesign); header/nav, footer
- Title of film (Cartel Land)
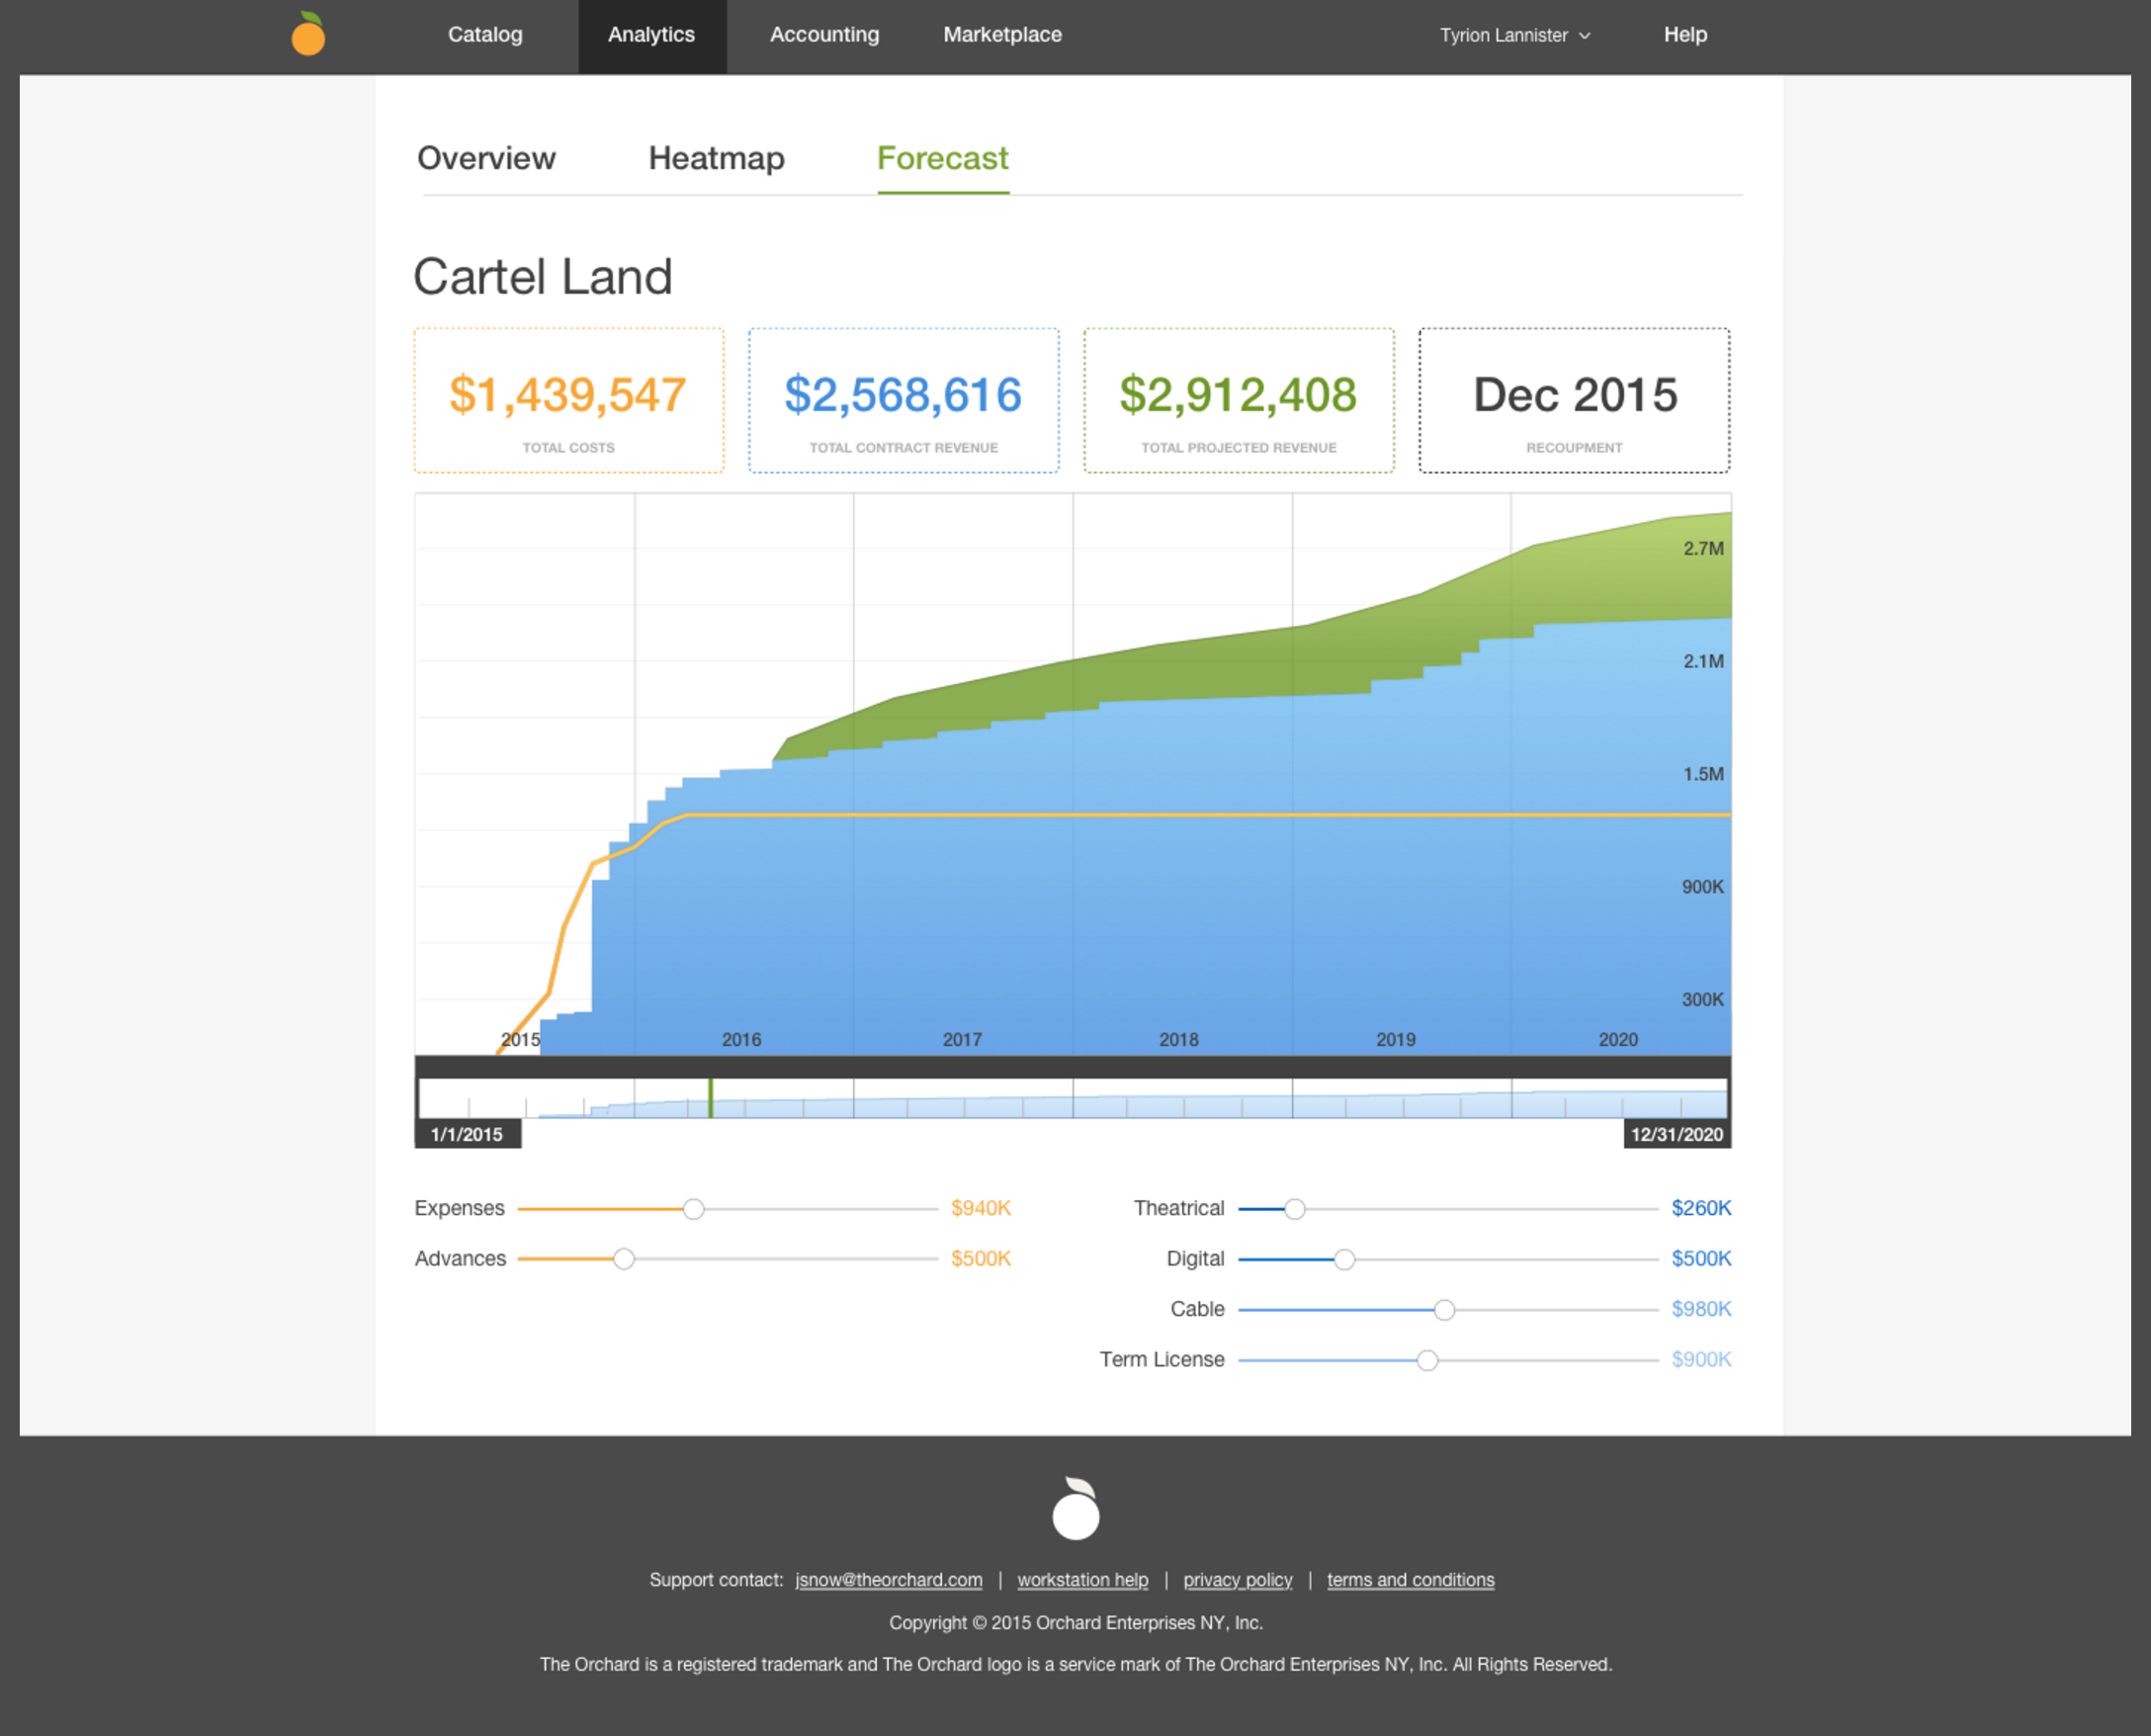
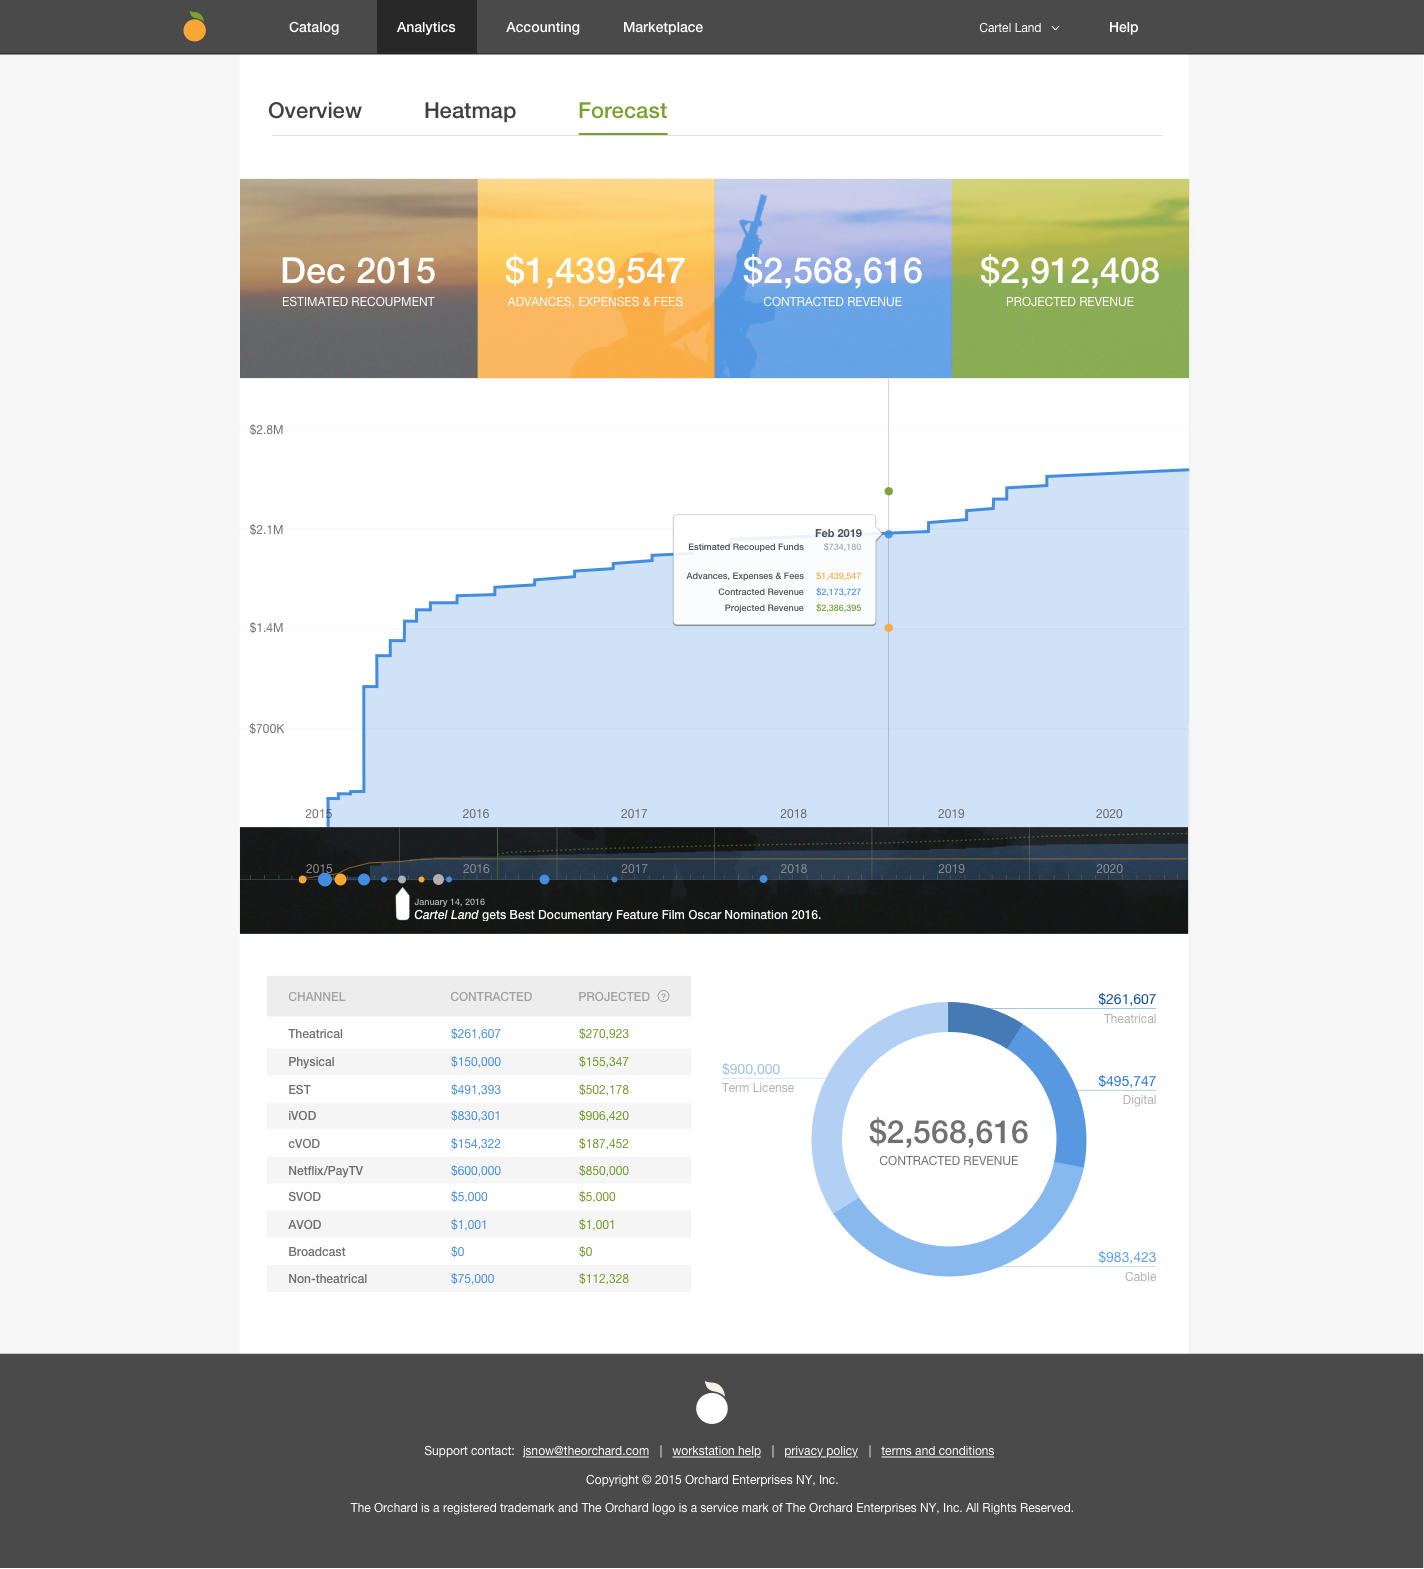
- Aggregate, cumulative revenue (digital, theatrical, cable, term license); round to whole #
- Contract revenue
- Projected revenue
- Ability to change timeframe view
- Revenue breakdowns, with ability to proportionally compare
- Recoupable costs
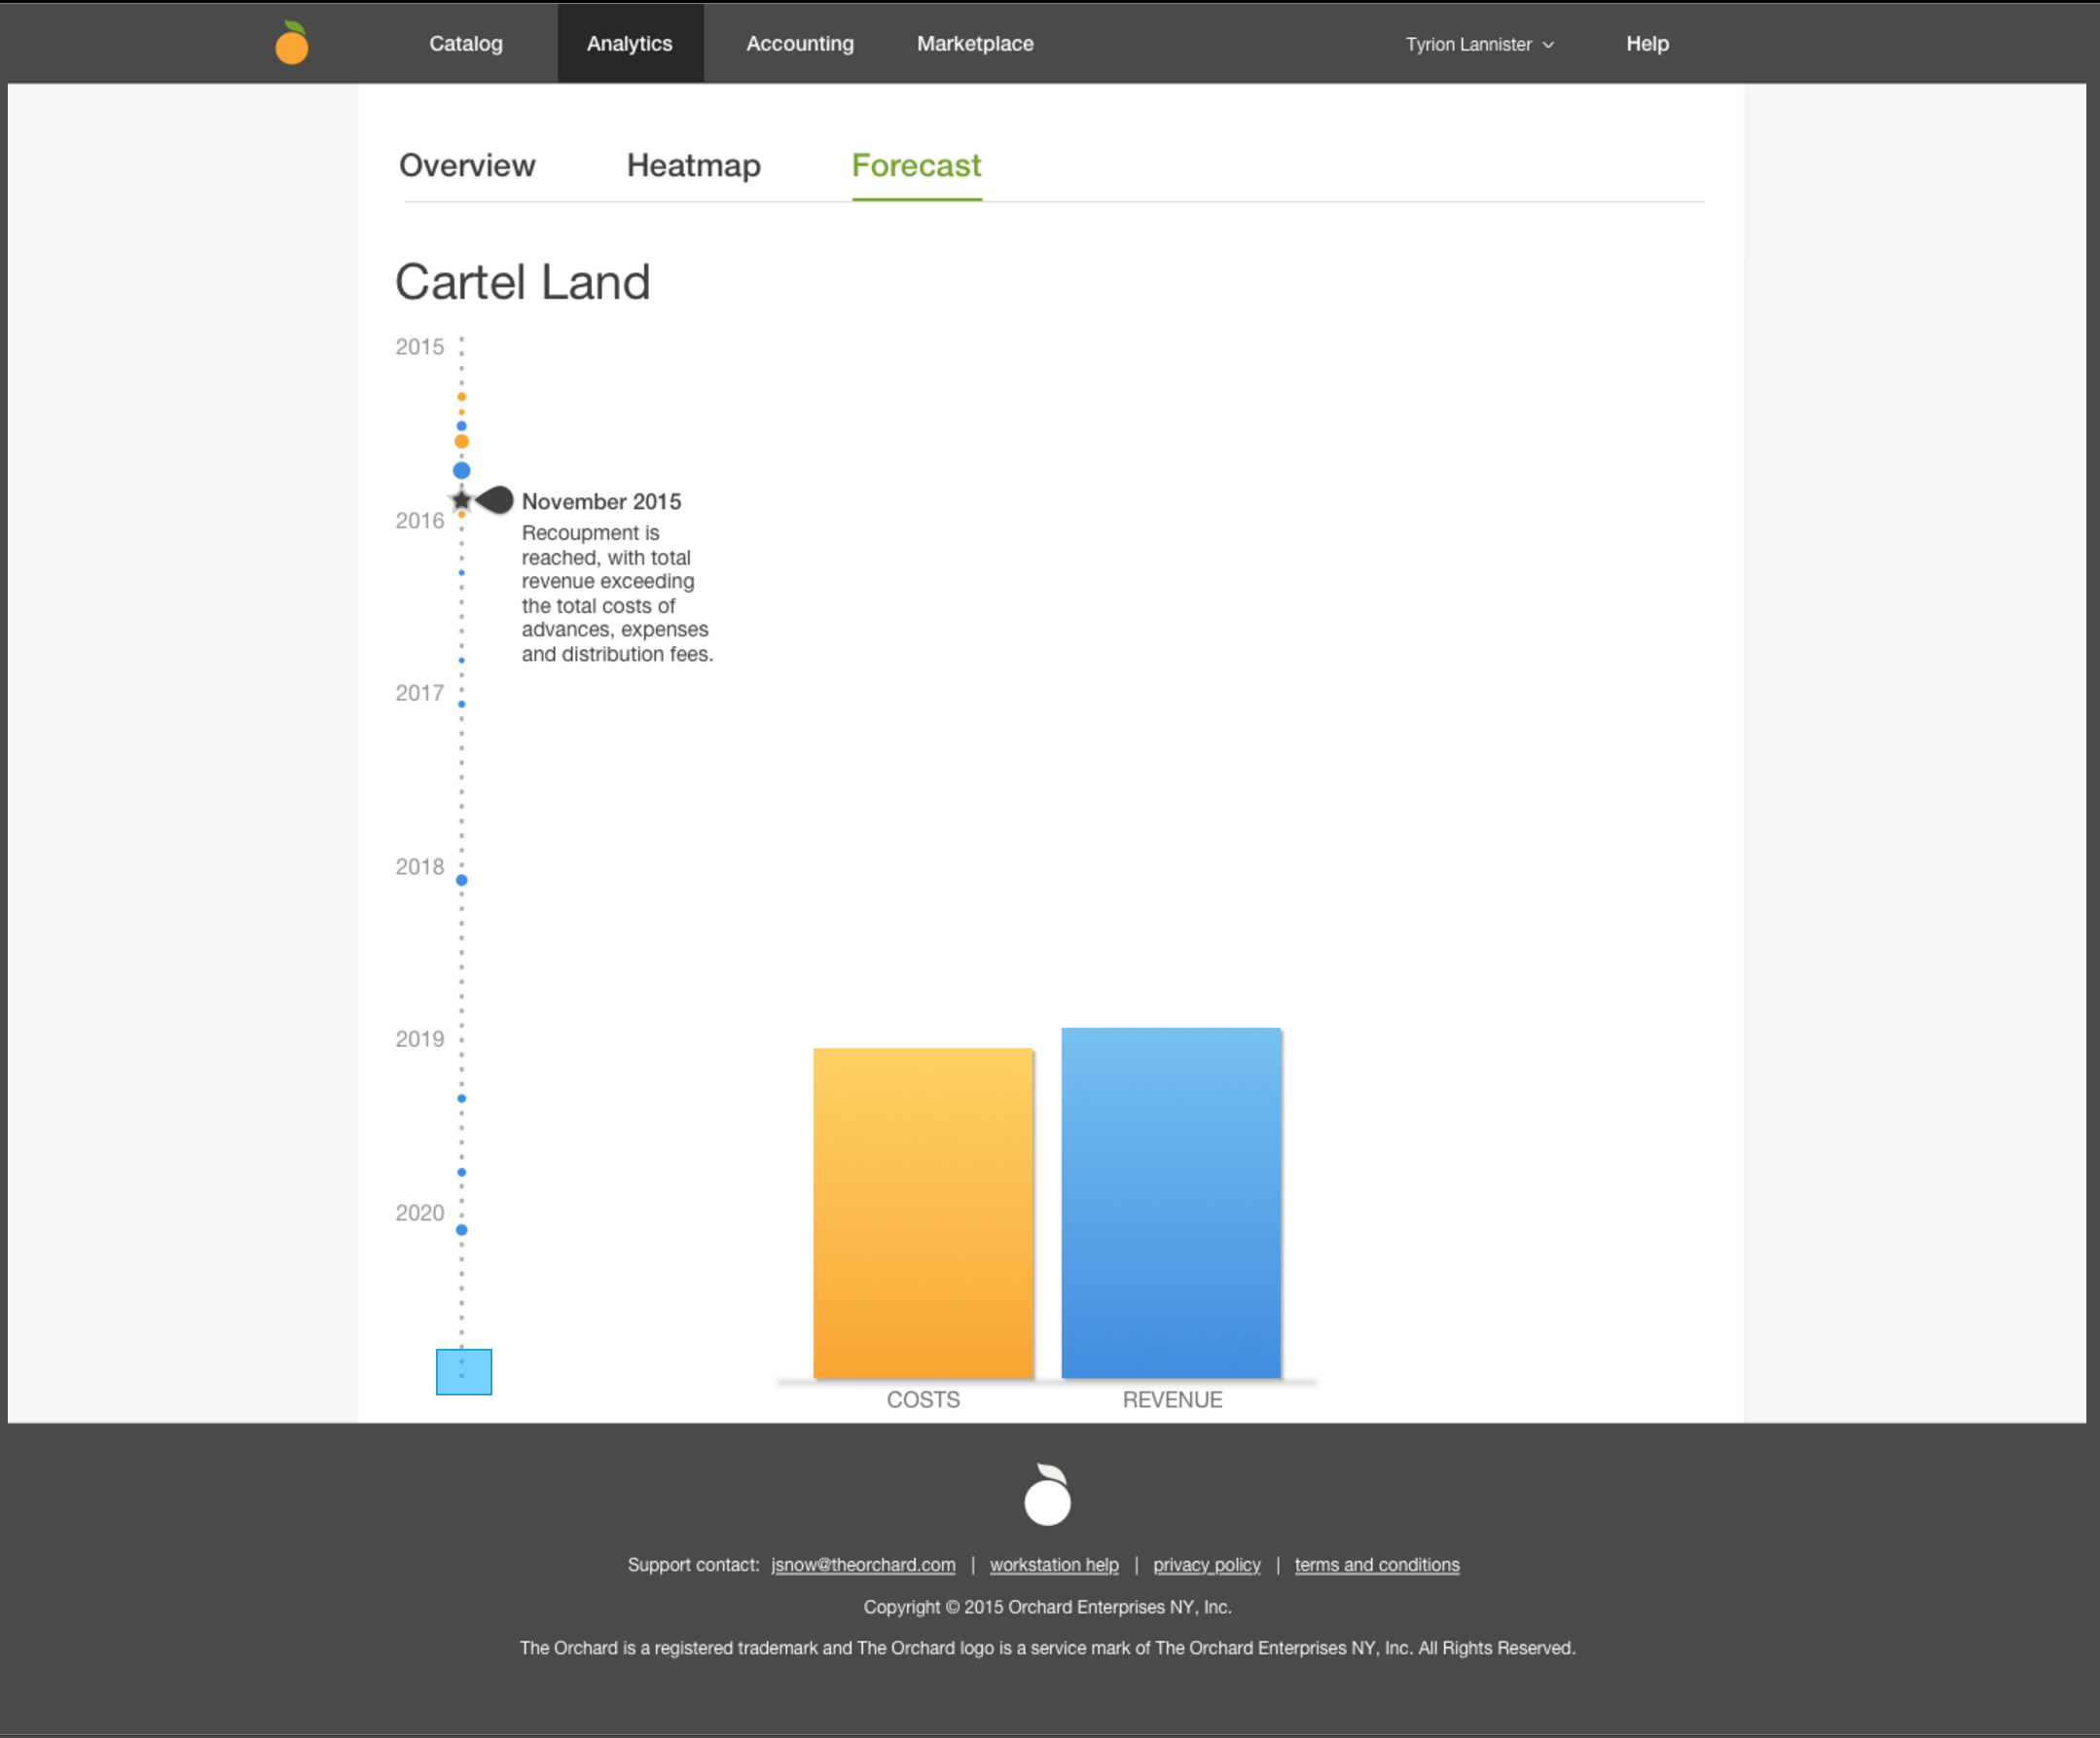
- Recoupment point
- Integration of windowing
- Ability to manipulate variables to see impact
- Advances
- Revenue*
- Visual separation between real and unsolidified data:
- Real - Contract revenue, Costs
- Unsolidified: Projected revenue, Recoupment date
DESIGN CONCEPTS

FINAL PR DESIGNS
At the end of this process, the designs settled on to move forward with for the Press Release were:


FINAL DELIVERABLE: Film Transparency Tool in The Orchard Workstation
Goals
- To provide a single interface which models all revenue streams brought in by our top film clients - digital, term license, cable, and theatrical
- To close the gap in delay time between when The Orchard is aware of revenue associated with a film and when that revenue is reported to clients. These gaps occur with all of our non-digital revenue sources (i.e. With Netflix, we know the details of a term early in the film’s initial release, but could potentially take years for a client to see how that term models out in the tool).
- To clearly indicate when a client will reach point of recoupment through a project financial forecast. Transparency is unique competitive advantage / value proposition / first
- Other distributors didn’t go for it because they didn’t see the business advantage, and they thought that exposing the numbers could harm themselves
KPI
- What does success look like, and how do we measure it?
- Qualitative: Positive feedback from clients
- Quantitative: Acquire more clients, particularly in a theatrical expansion
- PR success
- Sony will not be holding us accountable to any numbers
Competitive Research

Users / Clients
Client Types
- Clients using the tool will fit into the following criteria
- Single Film clients
- Theatrical Clients
- Clients with an Advance or incurred Expenses
- Top Digital Clients
- Indie filmmakers / Outside of the “studio system” / Not one of the “Big 7”
- Studio system lifecycle entail: Producing, acquiring, Developing, Distributing, Marketing
- Independents: Finish their films, bring to market, sell rights away to winning bid
- Many clients are retention customers. We take on about 12 film/year
- It’s an indie film producer’s job to oversee revenue, royalties, residuals and recoupment -- which all indicate that the film is making money; this responsibility lasts the entire lifespan of a film and is a huge time commitment (src: All About Indie Films)
- Clients have varying levels of savviness for the finances and how money is moving and windows are working
- Client groups
- Film - Some expert producers with limited time but quality feedback
- TV
- Sports Video - Most tech-savvy users
- Holistic user story (touching on the use cases, but bigger picture idea)
- Once a team completes their film, they are looking to get into the market. They bring their film to festivals (e.g. Sundance, SXSW) to show it. Companies like The Orchard make bids on it. If the bid is won, they pay an advancement as the distributor based on reviewing the film. The film producer essentially sells away all their rights.
- When clients sign contracts, may be long (e.g. 7 or 10 years)
- Structured through windowing
- Clients receive an advance upfront, but pay for distribution fees and want to reach (or exceed) recoupment
- Target audience
- “Labels” that set up this system as a one-time thing; partially because of the longevity of the lifecycle
- TV people not considered part of the target audience
- Indie film producers
- They put their sweat, blood and tears into their films
- PAIN POINT: When the advancement is made and rights are sold over, they want to know how their baby is really doing but can’t; DT: “As soon as the check is cut, there’s no more transparency.”
- PAIN POINT: Disconnect - Receive accounting paper by mail that is not easy to understand. Comes at a 3-month time lag, so it’s confusing why what’s happening in real life might not match.
- Most producers typically understand the process of how this bidding system and revenues and distribution deals work, but the level of savviness will vary
- For a smaller percentage of clients (maybe only 20 people would use it today); really applies to few but extremely influential film big-guys
- Clients fitting into this criteria include:

User Research for our clients will be performed to help us better drive our design decisions for the tool as well as better define how users will be interacting with the product. Questions to consider:
- What questions do you expect to be able to answer through this tool?
- How often will you be interacting with this tool? Frequency of use?
- What data points would you expect to see in the product?
- What data points are you interested in seeing? (Assess their level of granularity with the tool)
Use Cases
- User desire: Show what’s expected this month or next 3 months down the line, etc.
- Current user behaviors
- Why do they come into the workstation? How frequently do they come into the workstation?
- Come into the Workstation early; Eager to log in at initiation, but they freak out because all they see is being in negatives (huge negative opening balance because of advance)
- Extremely focused on “When am I going to recoup?”
- Most used are 1) Accounting followed by 2) Analytics
- What information do they have access to? How is it accessed?
- Projections - Dan calculates this manually for some clients in spreadsheets
- Spending / Distribution/ Marketing efforts - Phone calls with client management team
- Workstation
- Accounting statements, Unit analytics
- What do they do with this information? What kinds of actions might one take?
- REWARD: Learn how to budget for the future
- REWARD: Feel alignment
- REWARD: Switch from a passive to an active role
- Activate own audience; do own promotions
- Put pressure on sales team
- If an ultimate projection wasn’t reached, they might speak to their marketing team about how to improve meeting it.
- What kind of feedback has been received?
- Trouble differentiating between analytics and accounting; data not separated in a user’s mind; The Orchard (‘s account team) mistakenly gets blamed by users for number feeds that are pulling from retail stores
- Timelines are confusing; many users don’t really understand how timing and events work
- Advance shows up when they first enter the system, so they start with a huge negative balance; freaks them out
- Helpful to itemize expenses as opposed to see giant numbers
- Lack of transparency to events like marketing efforts
- Lack of insight into why numbers/analytics might drastically change sometimes; inadequate information and presentation to draw any correlations
- Excitement seeing something like a boost in digital sales and a heatmap of iTunes showing that
- Difficulty locating statements
- When users freak out about the negative opening balance, they likely have a phone call with The Orchard to be reminded of licensing fees (if applicable) which can be used to try and inform them when (or if) they will ever be out of the hole (i.e. recoup)
- Why do they come into the workstation? How frequently do they come into the workstation?
Visualization / Interface
- A single interface where clients will be able to interact with an all time view of their film’s performance
- Ability to show an “ultimate” view of the film’s performance - from the beginning to end of The Orchard’s rights of the film
- All data will be presented cumulatively
- X Axis: Time set to the client’s desired date range - fit to scale
- Y Axis: Revenue in USD
- User Experiences and Interactions:
- Being able to differentiate past and “today’s” data from future projections
- Hovering over daily activity will provide a full P&L in the form of a pop-up breakdown. Daily P&L will show accumulated amounts per channel
- Revenue
- Digital
- Cable
- Theatrical
- Term License
- Recoupable Fees/Charges
- Expenses
- Advance
- Revenue
- Adding a marker on the graph to represent the start date of a notable event (digital promotion, new publicity, etc) - similar to Marketable events today
- Filters and Breakdowns:
- By Store
- By Channel
- By Country
- By All Revenue
- By All Expenses
- By Desired Date
- Chronological
- Last Week, Last Month, Last Year, All Time
- By Paid/Free Transactions - Available for Cable and Digital only
- By Format Type - Available for Cable and Digital only
- By Market - Available for Cable and Theatrical
- By Transaction Type
- Possible graph types/styling:
- Stacked
- Line Graph
- Day 1 of the graph should be the first Recoupable Fee incurred (Expenses, Advances)
- Projections per channel will occur on the first day a channel’s revenue has been received
- We may build two graphs for this tool
- Actual, received revenue view
- One Month
- Three Months
- Six Months
- One Year
- Day 1 to “Today’s Date”
- Actual, received revenue + Projections view
- Actual, received revenue view
- Film client should be able to choose from the following views (timewise):
- One Month
- Three Months
- Six Months
- Day 1 to “Today’s Date”